Earlier in the offseason, I broke down the current free agent market spending trends and put them in context with spending over the last several years. As I noted then, the market seemed all but certain to take a huge leap forward in terms of overall spending levels.
Indeed, it has done just that. According to MLBTR's Free Agent Tracker (after removing non-guaranteed deals and the few exercised options or extensions that are reflected), $1.88B has been committed through this year's market. With more spending still to come, the total free agent pot has already expanded by nearly 30 percent over last year.
That is both shocking and unsurprising, given the oft-noted TV money that has flowed into the game. But just how dramatic, really, are the increases? Utilizing ESPN.com's free agent tracker, Dave Cameron of Fangraphs wrote yesterday that free agent deals had jumped from an average annual value of $4.87MM in 2009-10 to a $9.65MM rate in the present signing season. He observed also that multi-year deals were sharply on the rise, with ESPN's figures reflecting that closer to half of free agents were getting more than one year in the last two seasons while that figure had hovered in the 30% range for the previous three years. Ultimately, Cameron wrote, the increase in AAV and years combined to raise the average total commitment in a free agent contract from $7MM in 2009-10 up to $20MM in 2013-14.
With all respect to Cameron, and the useful ESPN data, the information relied upon in that post is incomplete, and the resulting conclusions — while directionally accurate — are somewhat misleading in some respects. MLBTR owner Tim Dierkes asked me last year to compile historical data on free agent signings in support of an effort at developing a projection system, I started from the MLBTR transaction and extension trackers and built it out by mining Cot's on Contracts, Cot's data on non-active players from Baseball Prospectus player cards, and ESPN.com's free agency tracker. I then supplemented those results with internet searches, including undertaking the difficult task of attempting to determine service time at the time that extensions were signed. While there may be some missing pieces, and best estimates were necessary for certain service time markers, I feel fairly confident that this data set provides a sound basis for analysis.
Here are the results of that research, along with the spending tab to date on the present year. It should be noted, of course, that while an unusual number of prominent free agents remain unsigned at present, the total figures will likely drop by the time this offseason is concluded.
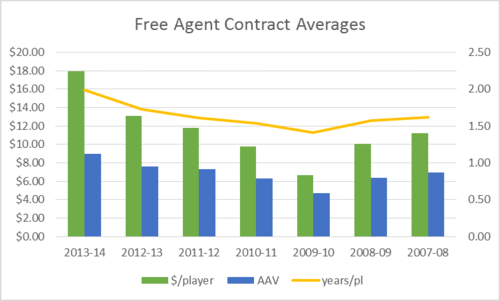
First, let's look at the overall figures for all guaranteed, MLB contracts handed out through free agency. (All dollar amounts in this table, and throughout the post, in millions.)
Clearly, though the trend that Cameron notes is still present, it is somewhat less dramatic than it first appeared. As it turns out, the ESPN tracker is missing a good number of deals, most of which are of smaller magnitude.
And, as we can see, the 2009-10 baseline is somewhat misleading. That year was, I believe, largely an outlier in terms of charting market development. There were internal factors at play: the market was headlined by Matt Holliday, John Lackey, Jason Bay, and Chone Figgins. Only Holliday landed a nine-figure deal, and only Lackey and Bay joined him with at least a $50MM guarantee. More importantly, though, the signing period took place in the midst of a massive, global economic downturn. That probably helped flood the player market with supply (notice the high number of players reached the market rather than being tendered arbitration or extended) and created obvious risk for teams in guaranteeing long-term money.
The curve is much less pronounced when using one of the prior years as a starting point. Comparing 2007-08 to 2012-13, we see that the average commitment per free agent contract has gone from $11.25MM to $13.07MM. That figure stands at $17.91MM for the ongoing 2013-14 period, though it will fall somewhat as the rest of a delayed market settles into place.
Moreover, while new local and national TV money is unquestionably having a dramatic impact, the hard-to-capture role of happenstance should not be ignored, either, in assessing the numbers. If, say, Robinson Cano had signed an extension with the Yankees and Masahiro Tanaka not been posted — both of which were certainly possible at various points — all of the roughly $400MM committed to those players would not have stayed on the market. Things might look much different had those two premium players not been available, or if the Yankees had chosen to stay under the luxury tax line.
Also critical to bear in mind is the fact that, as Cameron mentiones in the comments to his piece, many TV deals have only just been negotiated and will not reset again for decades. Those deals have raised the revenue streams of many teams and the league at large, but obviously none will increase annually at anything approaching the 30% free agent spending jump we've seen this year. (The Phillies' new deal, which I took a look at recently, is said to escalate at between 3-4% per year.)
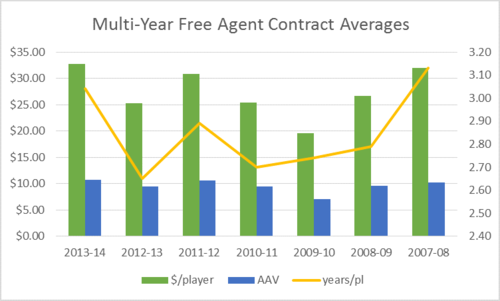
Now, let's isolate things to multi-year deals only. Over the last seven signing seasons, here are how things look for free agent deals that guaranteed more than one year:
The 2009-10 blip is quite apparent. Again, look at the 2007-08 numbers and compare them across to the present year. The total commitment per player contract, AAV, and average number of years look about equal. When the current signing season ends, I suspect, its multi-year segment will fall below 2007-08 by those metrics.
Of course, that is somewhat misleading in and of itself. After all, with more money being given out than ever before, it must be going somewhere. In fact, as Cameron identifies, the key is in the number of multi-year deals that the market is awarding. Without question, the absolute number of multi-year deals has been sharply on the rise:
While we will have to wait and see where the numbers end up on the present year, it does look like a jump from ~30% to ~50% overstates things somewhat. Between last year and this, my guess is the number will settle in below 45%. Of course, that still represents quite a dramatic increase in the slice of the free agent market that is commanding multiple years.
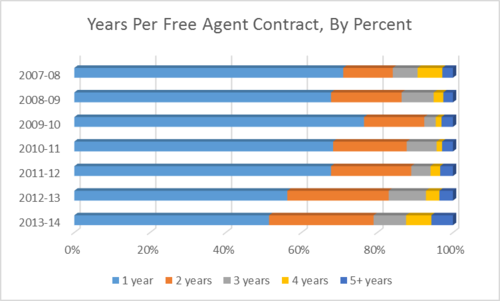
So, what kinds of deals are the ones driving the growth? I charted out the contract lengths in my dataset to see:
As those numbers suggest, there has been an apparent increase in two particular areas: two-year deals and contracts of four or more years. By percent of all free agent contracts:
With no additional roster spots, there has been a corresponding drop in the number of one-year pacts. Most likely, strong competition for the best players, combined with increasing financial flexibility, has led to additional years being given all along the spectrum of the market. Interestingly, this shows that financial benefits have trickled down to non-star players, although MLB veterans capable of earning guaranteed money hardly represent the bottom of the baseball world.
The increasing number of two-year deals has held down the average length figures cited earlier. Unmistakably, however, the length of free agent guarantees have risen quite substantially in recent seasons.


