
MLBTR has been around for 15 years, and in that time the statistics we use to evaluate players have continually evolved. Today we’re going to discuss the pitching stats we’ll be using moving forward.
I’ve been contemplating moving away from K/9 and BB/9 to K% and BB% for a while now, a switch you might have noticed in my Top 50 Free Agents post. As many have noted in recent years, it just makes more sense to look at strikeouts as a percentage of batters faced rather than use innings as the denominator.
The problem with strikeouts per nine innings (K/9) is its interaction with the pitcher’s hits and walks allowed. Imagine a reliever who goes three innings, giving up six hits and six walks while also striking out three batters. Because of all the hits and walks, he faces 15 batters in total. His K/9 is 9.0. Every hit and walk extended the inning and gave him a fresh opportunity for a strikeout. His K% is 20% (three strikeouts out of 15 batters), which is subpar.
Imagine a different reliever who goes three innings, strikes out three, and retires the other six batters. His K/9 is 9.0. His K% is 33.3 (three strikeouts per nine batters), which is good.
K/9, BB/9, and K/BB served us well for a long time. They are by no means terrible, and most of us know the benchmarks better. But when something better comes along that isn’t difficult to understand and makes more intuitive sense to use, then it’s time to rip off the Band-Aid and start using it. That’s why we’ll be using K%, BB%, and K-BB% at MLBTR moving forward. To get a feel for the benchmarks, check out this handy chart, reprinted with permission from our friends at Baseball HQ.
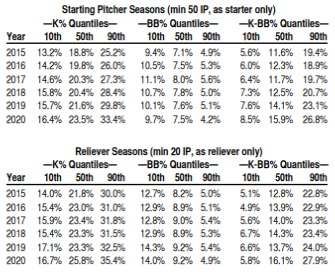
In 2020, the top-20 starting pitchers had a K% of at least 25, a BB% below about 7, and a K-BB% above about 18. Check out the starting pitcher leaderboard here. The top relievers strike out about 35% of batters faced, walk fewer than 5%, and have a K-BB% of at least 27. Play around with the reliever leaderboard here.
Notes on other pitching stats you’ll see at MLBTR:
- SIERA (Skill-Interactive ERA), developed by MLBTR contributor Matt Swartz, is my preference over FIP or xFIP. From what I’ve read, SIERA is the best at predicting future performance. Check out the 2020 SIERA leaderboard here.
- SwStr% (Swinging Strike Rate) is the ratio of swings and misses per pitches thrown. It can be used to help back up strikeout rate. Check out the leaderboard here.
- BABIP (Batting Average On Balls In Play)
- Groundball rate
- We’ll be using Statcast metrics at times, which are explained at the bottom of this page.
- I’m not a huge fan of WAR, especially in smaller samples, but it’s useful at times, widely recognized, and can be hard to ignore. It’s something I hope to unpack and reconsider when time allows.
- Don’t worry. We’re not going to abandon ERA.
Pitching stats you probably won’t see at MLBTR:
- K/9, BB/9, and K/BB for the aforementioned reasons.
- A pitcher’s win-loss record, with the possible exception of a salary arbitration discussion.
- WHIP, unless we’re writing about fantasy baseball.
i cant wait to not understand any of the stats here ever again because forehead.
That sentence makes no sense. Are you trying to be funny? It still doesn’t make sense.
Like many others I dont come here for stats, I come here for news. So go ahead and remove stats found in every boxscore like wins, losses, and I’m sure batting average and saves will be next. When theres new batting champions or the cy young winners are named I have plenty of other sources to inform me of 20-game winners and guys who batted over .330 in a season because other places realize those old stats dtill have some value. This is a great place for what it was originally meant to be, news about player movement. So no complaints here.
I can remember when the W-L record meant something. But since most pitchers can’t make it past 6 innings anymore (when in the past, the ace was expected to go 9), the W-L record became obsolete.
Quite sad, actually.
It never meant anything
Wanting “W-L” to mean something is like a doctor from the 50’s claiming “Lobotomies worked in my day!” We know better now. Stop being dumb or move aside for better doctors.
@RemovePitcherWinsFromTheRecordBooks
ROTFL at your name
A little extreme, isn’t it LFMAO
@Steve Nebraska
The best way to put it is you had to be there.
I can tell you’re a young guy (I’m guessing teens or twenties). Unless you were in that era, you won’t understand.
Not saying there’s anything wrong with that. It’s just a different era now, a different game. Just don’t knock it unless you’ve been there.
It’s overrated. but it does mean something. Just for example, if a pitcher pitches badly, he always gets the loss. But a pitcher can pitch well, but throw 25 pitches per inning, and be out after 4.2 innings, and not get a win in a 4-0 decision. Going deeper into games gives you a better chance of getting a W. Not a big deal, but like most stats, no reason to ignore it.
Not extreme enough*
You’re dead wrong @JoeBrady! There are plenty of instances where the pitcher pitches badly but his offense bails him out and he gets the win (or a no-decision). Pitcher wins must be stricken down!
Is this the same thing you tell people who were obviously wrong in the past? Don’t knock lobotomies unless you’ve been there. Don’t knock segregation unless you’ve been there. By refusing to accept knew information, a person is declaring to the world that they like to be an idiot. It doesn’t matter how the rationalize it, or what they feel. That is how they are portraying themselves.
It’s a law of nature. Adapt or die.
2015-2020 is a long period of time for DeGrom to under-perform Syndergaard. They both had identical offenses and defenses.
It’s been proven that two pitchers on the same team can get different levels of run support, even over extended periods of time. It doesn’t “always average out.”
@Steve Nebraska. So throw out anything that predates your generation because there are a handful of examples that support it. A win is most likely to occur when a pitcher reaches a threshold of innings and out pitches his opponent. It serves a purpose as a stat.
@Steve Nebraska
It’s hilarious the arrogance that before advanced metrics in MLB, we were all seen as Neanderthals with no math skills beyond the simplest of equations.
BTW, great job comparing W-L stats to lobotomies and segregation, because there are such striking similarities between them.
Scenario:
2 pitchers (A & B), 1 game each. Stat line for each:
A) 6 IP, 13 K’s, 2 H, 0 BB, 1 ER, No Decision
B) 9 IP, 4 K’s, 6 H, 3 BB, 3 ER, Win
Which one do you choose?
I choose B every time, because of (1) the win in hand and (2) he saved the bullpen, keeping them fresh. You only choose A if he’s on your fantasy baseball team (which I don’t play).
Yes, this is only 1 game, not a whole season, or an entire career, but maybe this gives you a glimpse on why we old-timers say there’s a time when the W-L stat actually meant something.
Look at Blyleven for example. He didn’t have the greatest overall numbers in the history of the game, but he pitched 60 shutouts. That’s 60 guaranteed wins. A complete game shutout is the best stat in MLB, because it is impossible by definition to lose a CG shutout.
I think the Joe Brady approach can represent a fixation on nostalgia and a fear of change. I think the philosophy of “Remove Pitchers Wins” can represent a fixation on the religion of Progress (and placing analysis of the sport on what people once called “the best and brightest” — aka a hired expert class of whom we should defer to). If this wasn’t about baseball (but it is) and about something more important (like culture or politics), I’d say both positions were a bit dangerous. But this is just baseball after all. Just don’t take these baseball philosophies into the real world
@anthonyd4412 “outpitches his opponent.” Stop it with that ridiculousness. A pitcher can’t control what the opposing starter does. And his final line looks exactly the same regardless of what the opposing starter does.
@83sox94win0 so you are saying a guy with a 3.00 ERA is more likely to win than a guy with a 1,50 ERA? LOL! ROFLOL! ROTFLMAO! Good thing you’re not a GM!
And yes I would take the guy with 6 innings of 1-run ball over the guy with 9 innings of 3-run ball. If your bullpen as a whole can put up an ERA below 6.00 (that’s really bad by the way) then statistically speaking, you will win more games with the 6 innings of 1-run ball.
@83sox94win05 those 60 CG shutouts are reflected in Blyleven’s career ERA!
@anthonyd4412
Sure. It designates a stat. That is correct. But a Win is in no way a determinant of a good outcome in and of itself and should NEVER be used to project future success. So why give that stat any significance?
@83sox94win05
I don’t if your feelings are hurt. Using a win as a stat to determine individual production and future success is dumb. If that was they best they had in the 50’s then so be it, but we have better now. So, use that instead. Why are you so resistant to better and more correct information?
@Tipsy McStagger Actually my approach represents an understanding of the fact that pitcher wins do not (and never did) have any place in baseball and that anyone who says differently needs to be institutionalized.
Couldn’t agree more with many of the posts especially win/losses for relievers. But you can bet your balls that wins still mean something to the starting pitchers themselves…
A few more hitting stats might be nice – there’s a few missed out on most sites:
Vital Insurance Runs Under Stress (VIRUS) – not popular right now
Hitters Earned Run Percentage Emphasising Strikeouts (HERPES)
Late After Running Under Stop Signs In Arizona (LARUSSA)
In other words a clutch hitting low strike out guy can be excused for getting excited when approaching 3rd base in hotter conditions….
I’m sure you guys can think of a few more, I’ve got an appointment in a place called Padded Cell….
@Remove
I just want a lobotomy rather than JUST institutionalization. Makes the time go quicker. Can you hook that up?
W-L isn’t a stat I put a ton of stock in but I still think era serves a purpose. At the end of the day or season for that matter what I want to know is how many innings did you pitch and how many runs did you give up. It is flawed in a couple of ways such as a starter getting pulled with a man on first and two outs and a reliever allowing him to score. Both share some responsibility for that. While it’s not dead on accurate it serves a purpose
@RemovePitcher…
Can you read? I hope you did not graduate high school, because if you did, your principal should be fired and your school should be shut down pending an investigation.
I said ONE GAME for each. If you still take away from my scenario that you would take player A, you have to be one of the worst decision makers I have ever come across. So instead of taking the sure win, you would gamble on 3 innings of bullpen pitching.
@83sox94win05 Your argument is based on assumptions favorable to your position. Namely, that the offense will do better on the days when the inferior starter is pitching. That is not how it works in real life. The pitcher can’t control what the offense does or what the opposing starter does. Especially not in the AL.
I will concede your point under the very narrow, very carefully constructed scenario that you have suggested where the inferior pitcher has some magical Harry Potter spells that make his offense play better behind him. But only then 😛
@Steve Nebraska
Your thinking is WAY out there. I am not resistant to better and more correct info. I do think there’s too many stats out there which leads to information overload, but at the same time, nothing wrong with improving upon existing stats.
You really don’t get it. Yes, you should not take the W-L stat as the holy grail of stats, there are definitely flaws in that stat (especially now that most SP’s can’t make it past 6). But when pitchers were throwing far more CG’s back then, there was more control over the outcome by the SP. Yes, it’s a team stat, but heavily influenced by the SP (or at least it used to be).
Amazing that you were never in that era, yet you criticize it like you were. That’s some serious arrogance.
@RemovePitcher…
How you know pitcher B is the inferior pitcher overall? You’re just assuming it. This is based on 1 game each. It’s possible pitcher B was Bob Gibson or Sandy Koufax who was just struggling that game. You don’t know who that pitcher was.
Yes, the W-L stat is affected by the pitcher’s defense behind him and his offense. But the pitcher has more control over the outcome if he pitches a CG. Sure he can easily still lose if he pitches a CG, but he has a better chance of controlling his destiny if he completes his game than to leave 3 innings for a bullpen to potentially blow. We’ve seen enough bullpen implosions in games to be stupid enough to believe a 2 or 3 run lead is a sure thing for a bullpen to save the game (and even the best bullpens can have those meltdowns).
@83sox94win05
W-L is not influenced by the starter. It never was. It is influenced by the offense. Unless the pitcher can also hit a couple home runs he has no control over that.
Sure, a bullpen can blow a 2 or 3 run lead. But statistically speaking, if your bullpen’s ERA is below 6.00 (which, I’m not even sure the 2020 Phillies’ bullpen was that bad), you are better off with the 6-inning 1-run guy than the 9-inning 3-run guy. This isn’t me talking, it’s the cold, hard stats.
@RemovePitcher…
“W-L is not influenced by the starter. It never was.”
Try telling that to Bob Gibson in ’68 or Steve Carlton in ’72 or Koufax in basically the first half of the 60’s decade.
Even back when the W-L stat meant something, that was far from the only stat I used to gauge a SP. And I am definitely not using W-L as a barometer for today’s SP.
The W-L stat had its time way back when and is virtually obsolete now. Let’s just leave it at that.
It never meant anything. Just because they hadn’t come up with better stats yet doesn’t mean wins and losses meant anything. Like I said, even in the days of Gibby, Carlton and Koufax, there existed good pitchers on bad teams who got less wins than inferior pitchers. Vice versa too.
It is high time we forget the win stat ever existed.
Changing stats in a lateral direction doesn’t mean it’s better. Being open to new Sabermetrics and trying to add to the statistics to predict future outcomes is fine. However, wins and losses still matters, unfortunately bot the way it used to be for multiple reasons (some good and others not so much), but the same objective is to win the game. who wins and losses matters.
Not saying this will happen and it better not but we evaluate teams by there record. Records are wins and losses. Let’s not determine outcomes by wins and losses anymore. Common Man, why do we watch these games, to see who wins and losses. If you take that away, then everyone gets a trophy and sports in general becomes obsolete of all competitiveness.
The simple stats are just as important as new Sabermetric stats that are still being worked out to determine if they are accurate or not.
I bet this Nebraska guy wants to tear down statues and monuments too, what a dunce.
Wins and losses are team stats. Not individual stats.
If starting pitchers still want to believe wins mean something, they’ll be out of the game soon due to their failure to adapt. We aren’t going back in time, so it’s time they accept and abide by the algorithms and sabermetrics and forget about wins.
You have no clue what pitching to the score means. Come up with a stat that differentiates between tossing 7 shutout innings in a 1-0 game and pitching 7 shutout innings with a 8-run lead from start to finish, then you’ve got something.
This is the stupidest thing I’ve ever read. Your ridiculously self-serving example only works on a 1-game basis. Sorry, that’s not how baseball works. Why stop at 3ER for pitcher B? How about pitcher B gives up 30 runs but lo and behold in the greatest game ever his offense scores 31 and pitcher B gets the win – I guess we go with pitcher B then! Except that’s not how baseball works, pitcher B goes down as the worst pitcher to step on a major league mound, let alone get a CG, and he’s bagging groceries by week’s end because he did everything he could to ensure his team would lose but was BAILED OUT by the offense. It’s exactly why W-L is obsolete, and exactly why any argument involving 1 game scenarios does nothing to advance the conversation and in reality you’ve wasted the time of everyone who read your post.
@Yankeefan24
Ummmm…with your example of pitcher B giving up 30 runs only to have the offense bail him out with 31…sure, I suppose.
But any manager who leaves their SP for the entire 9 innings after giving up 30 runs should be fired on the spot.
Common sense is not a bad thing. It’s not illegal to use your brain.
The fact you think there’s a difference between 3 runs and 30 runs demonstrates you don’t understand that my criticism is about your one-game sample size. One game means nothing. Obviously the most important statistic on a game by game basis is wins. Great job! But that shocking revelation adds nothing to a discussion of historical statistical analysis of pitchers.
A better question is do you take 180 innings of 1.50 ERA ball (Pitcher A 6 IP x 30 starts) over 270 innings of 3.00 ERA ball (Pitcher B 9 IP x 30 starts). Still go with 1.50 over less IP and that’s very likely the general consensus. The game has changed since 1970 lol your examples of Bob Gibson and Sandy Koufax are ridiculous.
@Yankeefan24
You (and certain others on this thread) completely missed my point. It’s amazing how you guys can go blind when someone talks about something you are completely against.
My scenario had absolutely nothing to do with which pitcher is the better overall pitcher.
My point is to give you an insight as to why for a long time in MLB history the W-L stat actually had some meaning. It was never a perfect stat to begin with, it was always imperfect. You had to follow the game more back then, whereas now you can get lazy and look up 20 to 30 stats you probably don’t know the true meaning of each stat.
But in a time where CG’s and shutouts were far more common (yes, believe it or not, that time once existed), pitchers had more control over the outcome of the game. If you throw a bunch of CG shutouts, you’re guaranteed to win. If you give up only 1 run in CG’s, you’re very likely to win.
Am I still going way over your head? Again W-L is not a perfect stat, but there was a time it meant something.
If you still can’t figure it out, there is no help for you.
As someone who studied statistics for hours on the back of baseball cards starting roughly 30 years ago I’m fine with won-losses era etc. I could really care less for all these new fancy pants terms.
I’d say that about 4-10 times if a pitcher has a good win-loss record, then they are a good pitcher. Look at Degrom. He wins about as many as he losses, and he’s the best pitcher in the game.
It’s more about getting to that 10-10 chance of making good stats equal a good player. It’s ok to stay more casual with stats like you are, but you also aren’t trying to predict players sustainability or production. MLBTR is. So you don’t have to use “fancy pants” stats, but that is what they will (and should) do if they want to be a reputable site.
Wins are as good an indicator of future success as any other stat.
A guy with a lot of wins had a very good year.
Wins are a weak excuse for a personal stat because half the time they don’t even give the win to the deserving pitcher. If a pitcher goes 7 scoreless though the other team is shutting out his team too, then he gets pulled for a reliever, if his team scores while the reliever is in the game, then the reliever gets the win. Not the starter who went 7 scoreless. It is too unpredictable, and it honestly doesn’t accurately showcase the talent of the pitcher whatsoever.
“Wins are as good an indicator of future success as any other stat.”
This is demonstrably false because: A) there are a metric ton of other stats that are better indicators of future success., and B) wins are a really poor indicator of future success.
A pitcher who had a lot of wins is on a team that had a good year, at least during the games he pitched.
Imagine Pitcher A, who gives up 4 runs per outing and ends up with a 5.5 ERA. If his team scores 5 runs every time he pitches, and has a bullpen that holds most of those leads, that pitcher will end up with a very good W-L.
Now imagine Pitcher B, who gives up 2 runs per outing and ends up with a 3 ERA. His team only averages 1.5 runs scored while he’s in the game, and the games he leaves with a lead are often blown by his bullpen. That pitcher’s W-L will be objectively worse than Pitcher A’s, despite having an ERA that’s 2.5 runs better.
Does that mean Pitcher B is better? Of course not. I purposely used ERA and W-L to make this point, because this has always been the case, long before there were better stats available to evaluate pitcher performance. W-L record never should have been used to evaluate, settle arbitration, or award the Cy Young, because it’s a team stat. Yes, the SP is part of the team, but wins are more dependent upon the rest of the team than any other basic stat, including ERA.
Pitchers with a lot of wins and with a low era are good pitchers. Trust me on this. You can take your spinny rate and your strikey-outy rate and your leverage per park and weather and jock supporter comfort rate and I will gladly compare my list to yours.
And this bs about “predicting” success? LOL, Get real. You guys have trouble predicting future trades, future salaries, and future playing positions on teams. You were afraid to predict win totals for god’s sake. Now you pretend to be able to predict future success of pitchers? Hardy har har
OK Kreskin, who will be a good pitcher in 2021?
I bet Beiber, Darvish, Cole, Marco Gonzales, Max Fried and Davies do really well… They were the top win leaders of 2020.
Now, try and tell me Jordan Zimmermann is better because he wins the spinny rate award?
Ladies and gentlemen, the very definition of an armchair expert. Congratulations on your wild success, Bobby!
They should adjust the way the determine the winning pitcher. W-L is important IMO
BobG is right.
At this point in the game of baseball, starting pitching is a hazardous position. They are limited, protected by coaches and given an unfair disadvantage thanks to what the game allows hitters to do. That said, a pitcher racking up victories is pretty darn good barometer and it should not be ignored.
The silly spin rate crap got the Blue Jays attention and they signed a crud pitcher to larger-than-deserved money in Robbie Ray. Spin rates can spin balls over fences because spin rates is just a cute, yet crappy measurement. It doesn’t tell pitchers they are good.
Old-school stats still matter. Ignoring it is plain ignorance. Bob has a valid point here.
I really enjoyed this whole thread. Mostly old men yelling from their porch.
I enjoy old school starts very much like RBI, W-L, batting average, etc but wouldn’t argue that they are very valuable at all at predicting future performance or even determining if a player was particularly good. You can like stats while accepting their flaws
Bongibsonfan- You described the very reason why the stat is kind of useless now. You say it would be good for future indicators yet your reasoning is for the past.
The stat is not useless. Look at the pitchers with a lot of wins… they are good.
All a win means is that the TEAM won that game and the pitcher recorded at least 1 out.
@BobGibsonFan LOL! Guess we know why you’ll never be a GM LOL! ROFLOL! ROTFLMAO!
tell Aaron Sele that
Look at Degrom. He wins about as many as he losses, and he’s the best pitcher in the game.
————————————————————–
There is probably no way to prove it, but I do believe that some pitchers win more or less than they theoretically should. Degrom has a 2.60 since 2015, with a 61-45 (.575), while Syndergaard has a 47-30 (.610) and a 3.31 over the same period. There’s a lot of variance in those numbers, but it is a material difference.
Drew Hutchison went 13-5 the year the Jays were the best team in baseball with a 5.57 ERA. He did not have a good year.
Kevin Millwood and the 2005 Cleveland Indians may have something to say about this.
Well, according to this strikeout percentage stat, the best reliever in the AL in 2020 was…
James Karinchak of the Indians with a 48.6% strike out rate. I have to admit, he has some decent stats for a reliever. An era of 2.67… 17.7 K’s per 9. in 27 innings. Not too shabby. Not a closer though. Only 1 save with 3 blown saves. He did a good job though… no doubt. But is he really what you think about when you think of a lock down reliever?
Zach Britton, the Yankee closer, was 199th when set to 10 inning minimum. He only pitched 19 innings. But he had a solid year. 7th in the AL in saves… 1.89 era. 8 saves… no blown saves… a WHIP of 1.00. The guy was pretty good. Well, not by MLBTR’s standards. he didn’t qualify because of not enough innings.
2019 he qualified… he was a more respectable 116th. Not too bad for a guy with an era under 2 in over 60 innings.
I have to agree, wins is a poor indicator of a relievers abilities. So are saves… many don’t get save opportunities. This is where I would focus on era and WHIP. But certainly not strike out percentage. Sure, it’s a cool stat. Chicks dig the K’s… well, obviously MLBTR’s does.
It has been proven that two pitchers on the same team at the same time can get different amounts of run support. Yes, even over extended periods of time. It does not always average out over time. Unless Syndergaard is also a good hitter (I don’t care enough to look up how he does there) the pitcher has no control over that.
To put Davies and Gonzales in the same stratosphere as Cole, deGrom, Darvish and Bieber shows the fundamental flaws of pitcher record.
Look at 1924 MVP winner Walter Johnson… led the league in practically every category… wins, era, innings, shutouts, strike outs…. he would have lost out to Dazzy Vance of the Robins. 21.5% for Vance 13.8% for Johnson.
Hutchison got a huge raise after that season… just saying.
What measurement would you use? If it’s not wins or ERA or WHIP, I will argue. I can see any of those three used to determine the greatness of a pitcher.
Don’t give me some spinny thing or strike out percentage.
Syndergaard is a good hitter. Often, he has been the best hitter in their lineup when he pitches. Of course, it’s the Mets, so it’s not a very high bar.
Strikeout percentage is just strikeouts divided by batters faced. Ovbisously, there’s more to the game than just strikeouts like walk rate, home run rate, but it’s more important to look at that, as well as SIERA, xFIP, etc than wins/losses. ERA and WHIP are good barometers as well as FIP because it’s simpily just strikeouts, walks/hit batsmen and long balls. However to throw out strikeout rate is not very smart. I get you can have a 30%+ strikeout rate and be a bad pitcher, but you can also win 15 games and be a bad pitcher as well.
Zack Britton has a standout skill. It’s his groundball rate. I definitely believe in looking at that, and I erred in not including that in the post. So I will add that now.
@Rangers29 or the closer comes in and blows the save then his team walks it off in the bottom half and he gets the win.
@BobGibsonFan Pitchers with no wins and with a low ERA are just as good. Arguably even better.
If Bieber, Darvish, Cole and whoever else you named got no run support, they wouldn’t have gotten any wins. If that had happened, my opinion of how they pitched wouldn’t change one bit. And neither should yours.
@dkcsmc1991 Actually they should just get rid of winning and losing pitchers entirely.
Min. 60 IP
Rotation based on win total:
Bieber
Darvish
Gonzales
Cole
Davies
Rotation based on SIERA
Bieber
deGrom
Maeda
Bauer
Darvish
Rotation based on K%
Bieber
deGrom
Bauer
Lamet
Giolitio
Have you noticed there are pitchers that are really good, but just don’t get that many wins? Felix Hernandez, Patrick Corbin and deGrom… these are excellent pitchers but just have the hardest time racking up wins. Unlike guys like Cole, Verlander, Kershaw… these guys get the wins and they have low era’s and low WHIPs. Why the difference? King Felix, Corbin and deGrom have had solid offenses behind them, but they are all just over .500.
There has to be a reason.
In 2018, you have Robbie Ray at 6 and Matt Boyd at 8.
Ray was top 5 the 2 years prior.
Brandon Morrow was number 3 in 2011… they guy had an era over 4 and a .500 record.
Sure, these stats are cool and sometimes you can predict who will be near the top. The great pitchers will be near the top in all these stats, that’s why they are great. But sometimes you get a head scratcher… why is he up there? I get it. That’s why you cannot rely on one single stat to guarantee success.
And this bs about predicting success… LOL. Good luck with that.
“Felix, Corbin and deGrom have had solid offenses behind them…”
LOL!
@FredMcGriff for the HOF Clearly you are either lying or you didn’t study the right statistics. By the way “could really care less for all these new fancy pants terms” means you do care for them. At least a little.
“I could really care less for all these new fancy pants terms.”
It’s because you couldn’t begin to explain what any of them mean. All of the neanderthal announcers that decry advanced statistics and algorithms don’t have the slightest clue of what they’re even criticizing.
“I HATE WINS ABOVE REPLACEMENT!”
OK, what exactly does WAR tell you? What’s the formula for it? Oh, you don’t know? Enjoy irrelevance.
Just another reason why I don’t like baseball anymore! You guys keep changing the game;! Making it too complicated and boring!
I really like using SIERA, but look into DRA or deserved run average on Baseball Prospectus. I think it’s one of the best to look at future performance, even over SIERA.
They wrote this whole article because of Jeff Zanghi’s comment on the post about Will Harris and Howie Kendrick.
I wasn’t actually trying to claim that he had a good season or upset anyone. I was just merely saying that if you were Will Harris I don’t think you’ be looking at your (abbreviated – covid-shortened season) as a complete failure like it was portrayed in the article. I apologize if I offended anyone or the writers at MLBTR haha that certainly was not my intention. I was merely just trying to say that while yes his underlying stats indicated he had a sub-par year by his standards. when push came to shove… he more or less got the job done. His season was only 17.1 innings… basing an evaluation on that small sample size while focusing on the underlying advanced metrics is a bit harsh when at the end of the day… he did alright. Using K/9 or K% or K/BB or anything else you want to use… the fact of the matter is he performed adequately enough to only allow 6 ER in 20 games. And while yes… he did let up waaayyy too many hits per inning and walks (per inning or as a % either way he allowed too many hitters to reach base) he still managed to limit opponents runs at an adequate or better rate. Another thing that is completely ignored using % metrics is how many errors were committed during innings he pitched. one of the reasons he allowed so many extra hits and walks per inning is because the defense behind him allowed so many “extra outs” — again, sorry if I upset someone it wasn’t my intention. I was just merely trying to say that the bottom line results weren’t all that bad. and going forward I wouldn’t be as concerned about him as the article seemed to imply. idk maybe I’m wrong too… maybe his bottom line results were actually a result of him getting extremely lucky — and there is cause for significant concern going forward. Either way I didn’t mean to offend anyone or incite any sort of hostile debate… so I apologize if I inadvertently did.
Upon further review… there were actually only 2 errors committed while he was pitching. So I take back that line of reasoning… though it did result in 2 unearned runs very early in the season that could’ve set him back a bit to start the year.
I know I may be going on a bit too long here BUT after really looking through his stats for 2020… it actually seems like the biggest factor that impacted his % stats last year vs prior seasons was a drastix drop % wise in double plays. Which I actually found pretty interesting. I’ll have to do a significant amount more research to see how this actually plays out with more pitchers than just Harris. But I did find it quite intriguing that it seems as though him only inducing 1 double play all season long significantly impacted several of his advanced metrics. And if that was due to “bad luck” or if it’s actually indicative of a more substantial regression he may be facing due to, as the previous article pointed out, a dramatic rise in hard hit %… ill have to keep an eye on how his 2021 season goes as I will be interested to see if he can maintain the solid bottom line results even if his advanced % metrics continue to decline. And one last “confession” — i love baseball because of all the statistics. I am a MASSIVE statistics and %’s nerd its what I love so much about baseball. So my apologies for going on and on and again if I offended anyone. I just truly am very passionate and truly love reading about, analyzing and everything else baseball statistics related.
Jeff, I haven’t seen your Will Harris comments or anything like that, so me putting up this post was coincidental. It’s something I’ve been considering for a year or two and I got inspired when Baseball HQ took the plunge in their new Forecaster book.
I really like K/9, BB/9, & WHIP.
I think WHIP is a very undervalued stat. For one thing it shows how stressful pitchers innings are and how on the edge of success and failure a pitcher is. With relievers it shows which ones are better suited to coming in in the middle of the inning with runners on and which needs to start the inning.
6.145 – 16.986*(SO/PA) + 11.434*(BB/PA) – 1.858*((GB-FB-PU)/PA) + 7.653*((SO/PA)^2) +/- 6.664*(((GB-FB-PU)/PA)^2) + 10.130*(SO/PA)*((GB-FB-PU)/PA) – 5.195*(BB/PA)*((GB-FB-PU)/PA)
No one needs this type of analysis when looking at a trade rumor. ERA as arcaic as they want to make it, does the job just fine.
agreed
So, Pythagorean Theorem divided by Fibonacci Sequence equals the Golden Ratio… but only in day games on the road in August? Spiral out, dude!
Not quite, but the Fibonacci Sequence does have a limit of the Golden Ratio when you divide two consecutive terms.
Ah indeed, hence the spiral effect. Cheers bud! [ting!]
I totally approve of this post, but I will say, I still think WHIP is a very good stat to use in the process of evaluating pitchers.
I like WHIP, too, though I would like it even better if it included HBP.
I will miss you W-L.
xoxo
I know BanPitcherWinsFromTheRecordBook won’t miss it.
The irony is thick, MLB talking to 5Tool about the 1 most useless tool around on a post about stat tools.
Why? Its useless in determining pitcher performance. Just look at Porcello a few years ago when he won 17 games but got 5.7 runs per game of support and had a 4.28 ERA. Wins told you nothing about his performance.
I agree Koamalu
WHIP is a useful stat, not just in fantasy. Besides that, I can see where there going here.
Whoever decides to get rid of WHIP needs to be whipped.
With me just getting into evaluating players, this was a very helpful article. I have been recently looking at fip, xfip, Sierra, and era all together to get a good look at how sustainable somebody’s performance is, and if there are any outliers. I still have much to learn (as I was using K per 9 and Walks per 9 myself, before I saw this. I’ve seen DRA been mentioned as another good state before, so I’ll have to look at that too.
I also want to take a little bit of a dive on metrics that quantify a players worth to a team in the value of wins (WAR, WPA, etc) because I’d like to find a good one of those stats too.
Lots to learn, but this helped. Thanks!
If OPS is an important offensive stat shouldn’t OPS allowed be a good pitching stat?
No.
It is a good indicator of pitching performance if its adjusted for ballpark and for the defense behind a pitcher. Similar to how FIP, xFIP, and SIERA adjust for those things.
Yes, you can always take opponents OPS raw or adjusted. Opponents OPS in theory should be better than WHIP as the former captures both opponents OBP and SLG, while the latter is more comparable to opponents OBP.
I thought Swartz said that SIERA was an accurate predictor of future performance when you applied 450 innings of data. So basically 3 seasons. I may be wrong, but I seem to recall him saying that similar to WAR, you need a larger data set than 1 season for SIERA to be an accurate measure of performance.
or 5+ for a reliever
Did anyone notice the pitchers with the most wins were pitchers that were listed high on this list? Even pitchers on bad teams like lance lynn of the rangers, keller of the royals and Senzata of the rockies… hmmm.
You still can’t use pitcher wins/losses as a barometer for performance. Sure guys like Keller, Lynn and Senzatela were higher ranked with good win totals, but Dinelson Lamet, Zack Greinke and Brandon Woodruff all had 3 wins. Woodruff, Luis Castillo, Carlos Carrasco and German Marquez even had a losing record.
I don’t bother with losses. Just go straight wins and you will see the top pitchers in that list will be very close to the top list in any fancy formula list.
Or you will just see pitchers who play for good teams or pitchers who receive a lot of run support. As an example the former, Zac Gallen was one of the best pitchers in the NL last year. He was not in the top 40 in wins because Arizona was terrible.
An example of the latter: David Peterson (Mets) tied for 4th in the NL in wins. Jacob deGrom was nowhere near the leaderboard. However, deGrom was way, way better than Peterson last year.
Wins are just about the worst possible way to evaluate a pitcher among currently used stats. Even plain old ERA, which all of its shortcomings, is far superior.
You know what? Peterson had a pretty good year. Peterson had 2 more wins than deGrom. While deGrom was striking guys out, with his 1150 pitches, Peterson was getting guys out with his 800 pitches.
But deGrom had the spinny thing going for him.
Peterson also pitched 20 innings less than deGrom and the fact you want to compare Peterson and deGrom based on wins and losses shows why its flawed beyond belief.
350 pitches in 2 extra games… YIKES! You told me.
I would take into account their era’s, wins and WHIP. Just basing it on strike out percentages is silly. Some pitchers induce ground balls and get out of an inning on 3 pitches. Guys like deGrom will take at least 9 pitches every inning.
That being said… Peterson had a good year.
2 more games and 18.1 more innings are way different things. I’m not basing this on just strikeout percentage, nor am I saying that Peterson didn’t have a good year. If you looked at how many pitches they thew per inning on average, you’ll see that they threw about the same amount of pitches. deGrom averaged 16.7 and Peterson averaged 16.4. He struck out less batters than deGrom, but he also walked 6 more despite pitching 18.1 less innings.
Well, we do use groundball rate.
So are you saying that 2014 Andrew Cashner and 2018 Jacob deGrom weren’t among the best starters in the National League?
I’m curious as to how Max Fried managed to not make either of the two lists. I mean he had an ERA just above 2, didn’t walk anyone and gave up a total of 2 HRs (back to back last game vs the Fish after he tweaked his ankle and was then pulled) and the stats are saying he’s not going to be one of the 50 best pitchers going forward?
He didnt pitch enough innings to qualify. I had to change the inning count.
Look at the list for previous years… you see the usual suspects at the top of the list… deGrom, Verlander, Cole, Kershaw… might just as well go by win total.
Do you think that Jason Vargas was one of the best pitchers in baseball in 2017?
Kershaw was screwed in 2012 NL Cy Young voting. He beat out Dickey in almost all old school and newer pitching stats including ERA, WHIP, ERA+, K/9, H/9, HR/9, FIP, WAR but still a landslide win for Dickey. Dickey had a better BB/9 and K/BB. I think the Dickey feel good story and much better wins/winning percentage swayed the voters his way. My guess is that Dickey had much better run support than Kershaw, and faced worst opposing pitchers than Kershaw.
I would mainly just say that Max Fried is not a 2.25 ERA pitcher, which I think we all understand without getting deep into stats.
We can also say he’s a really good pitcher who we expect to post a sub-4.00 ERA in 2021. We could expect an above average strikeout and groundball rate to support that. I’d be hesitant to put a ton of weight on his 2020, since it was only 56 innings.
In terms of his control in 2020, he did walk 8.5% of batters faced, which is a bit subpar for an SP. There is reason to think his rise in BB% in 2020 was a fluke, though.
What’s wrong with WHIP? (Besides not including HBP.)
WHIP is just as good.
New and more complex stats are promoted to create a demand for the few places that can provide them. Theres no money to be made on older and more easily accessible stats, especially one like WHIP which anybody can easily calculate.
Are you calculating the stats yourself? I would say 99.99% of fans are using websites to look at stats. Ease of calculation is pretty irrelevant.
I agree with everyone who’s pointed out that this is a trades & FA rumors & reporting site, so the stats used (or ignored) in the articles are a distant second in importance to player movement.
As to those stats, however, you can have your SIERAs and your xFIPs and whatever else you like.
Some will stay around (OPS and WHIP were once fancy newfangled indicators), and some will be abandoned (Total Average, anyone?)
But until the pitcher’s Triple Crown includes WAR, or you show me a Cy Young winner with an ERA north of 4, I’ll continue to regard W-L, ERA, SO (or even SV, ERA, SO for relievers) as the key pitching stats.
Stats are designed for ALL players not just Cy Young and MVP caliber players. The advanced stats help to identify potential sleepers, forecast decline, indicate just how good the superstars are compared to history and truly what a players impact is to a teams success. It’s not hard to see that Mike Trout is good, but it’s the hidden qualities that advanced metrics can uncover that make them extremely valuable.
I agree. Everyone should choose which stats should work for them and look at those.
Just like a true moneyballer, inventing needless stats to justify their job.
Yes, that’s why I’m going with a different denominator for strikeout and walk rates. You caught me
I’m fine with using new stats…IF ….”Good”, Bad” and “Average” are defined.
So often, writers throw these stats around without providing the benchmarks, which make them meaningless.
So………in short, thanks for including the table with the Quantiles.
Yes, amazing how whiff-o-matic things have gotten the last five years.
THIS absolutely. I know what a good WHIP or K/9 is. I now have to be extra vigilant on learning what good K% is.
I find it fascinating that teams use these stats and then continue to make stupid personnel decisions like signing Robbie Ray to 8 m or signing Tanner Roark or or or.
“Trust the process”
because they don’t get that there are fairly frequent outliers. Alex Colome is despised by FIP but always does well.
I think teams use way better stats than these.
But even they can’t predict the future, so bad signings will always get made.
What percentage of MLBTR subscribers are fine with this change? Sure, there are a lot more non subscribers visiting the site on a daily basis, but it just makes one wonder if those that were encouraged to experience MLBTR without ads and exclusive articles signed up under the notion that there wouldn’t be an abandonment of the noted statistical information.
On the other hand, what percentage of those subscribers have longed for such a change?
Either way, I’m fine with it. Just curious.
I don’t know the answer to that. If I polled our readers (subscribers or not) before making changes to the site, it would be a mess.
In terms of abandonment of stats, it’s worth keeping in mind that in 15 years we pretty much never used pitcher wins or WHIP. There’s one actual change here, and it’s from K/9 and BB/9 to K% and BB%.
Whatever makes you happy and keeps you engaged to run the site for another 15 years.
And not that you’re asking, but I view the MLBTR purpose to be the aggregator of rumors, obscure notes and occasional analysis on big stories so I don’t have to follow 30 beat writers, PR spokespersons, or anyone else with interesting baseball knowledge every day. It’s never going to be perfect, but you have a very low K% in that regard, so thanks!
I’d like an explanation for not using WHIP when you have a chance, I feel it’s very useful for a starting pitcher.
Just as useful for a reliever.
I think relievers WHIP is more important than starters. Relievers, you rely on for one or two innings. Maybe three if they’re a long relief pitcher. Most of the time, their used in higher leverage situations. A bloop single here, walk here is much different for a starter who pitches 5, 6, 7 innings rather than a guy who throws one or two innings late in the game.
This is a good change. The switches from K/9 and BB/9 to K% and BB% are well-explained. Thanks
Hang on. You said the reason you are getting rid of K/9 is that it doesn’t account for how many walks and hits you give up in between the strikeouts. I get that. There’s a stat that measures walks and hits per inning pitched……… that you are also abandoning? I don’t understand the logical jump there at all.
As indicated in the writeup for this decision, most stats need more information to go along with them. To go along with the type of logic that you listed, .A guy that strikes out 1/5 batters (20% k ratio) but gets a lot of easy groundball outs and pop flies in between is definitely not worse than a guy that strikes out 1/3 of batters (33% k ratio) but gives up walks, homers, doubles, etc on the batters in between.. So I’m not following the reason for getting rid of WHIP.
K/9 on it’s face does not account for walks and hits, but K% does. It is a better stat. Just as BB/9 doesn’t account for hits or Ks, but BB% does.
“A guy that strikes out 1/5 batters (20% k ratio) but gets a lot of easy groundball outs and pop flies in between is definitely not worse than a guy that strikes out 1/3 of batters (33% k ratio) but gives up walks, homers, doubles, etc on the batters in between.”
Yes, but they guy is better at striking guys out which is the point of looking at his K%.
I agree with all that, but it doesn’t really answer the question on why WHIP would be taken out instead of used in conjunction with k%. I still want to know for sure what’s happening to those other batters in between the Ks, which was sort of the main argument for taking away k/9 anyway. I understand it’s better, but it’s *Even* better with whip attached.
Thank you for this explanation. There’s been a bunch of the stats that I’ve never understood so thank you for putting out this article it really helps a lot.
I’m looking for the batting and Fielding articles next. Thanks again.
A couple years back I changed the pitching categories in my local hometown Fantasy league to K/9 and BB/9 because everyone in that league reads MLBTR….
All this sutff is nice, but balance it with an inherited runners scored stat to tell someone how effective a “ relief’” pitcher really is. Mets fans have marveled at Edwin Diaz’s stuff, and his number here out him near the top. But they have been frustrated in Queens by his mediocre ability to strand runners on base. He has gotten better over the thee years, but he blew too many games by giving up a hit to tie or lose the game, and the. Striking out the side. Again, he has gotten better, but his strand rate started out terribly and left a bas impression in fans minds that he needs to change. .
I would rather have a pitcher get the ground ball double-play to end an inning, and yes that strikeout when necessary, than be an all or nothing relief pitcher. That’s why other pitchers who throw “junk”look as effective along side these “blow them away “ guys, though these stats say they shouldnt. Sometimes the trained acout’s eye is way better than the sortable excel spreadsheet.
Ugh. Don’t “throw out” any statistics. Just because a stat doesn’t inform you enough about a player doesn’t mean it doesn’t have value. Wins still mean something, just not as much as previously As new statistical measures become available, the old ones are not obsolete. In fact, it might be really useful to look at some stats, old and new, side by side. If there was a statistic that informed perfectly, everyone would use it. Since there is not, stats will continue to evolve. Stop rolling the die, the probability of a one is still 1/6. Why do you need to roll the die to see that? Because that’s theoretical probability. So even if it’s accurate, you still roll the die. Even if you knew everything possible about a player, that’s still theoretical. You don’t know the outcome. That’s the beauty of sports.
I agree. And with baseball, there are so many things that can be measured and analyzed because it is an individual battle within a team sport. Pitcher versus batter. Yeah, defense and ballpark configurations and other factors, but really just pitcher versus batter. The game right now is about power against power. At least until the next Ricky Henderson comes along and puts speed back inti the game. But the pitcher/batter battle can be about deception and “smarts”, keeping a hitter off balance with one on the belt buckle every now and then. And pitching in pressure situations. It’s all good. And makes for great conversations using statistics. . But it is not all about statistics.
I appreciate your letting us know what SIERA stands for (at least us that don’t know). But could you define it? Maybe just let us know what the skill interactive part is measuring, how, and how that affects the standard ERA calculation. And maybe why it’s good/necessary/helpful? Thanks.
Yes, I think that would make for a good article and I’d learn from it as well.
Never quite understood the point of using K/9 BB/9. Since when do pitchers go 9 innings that we felt the need to extrapolate stats to a 9 inning base? How does this make sense for a reliever. This change was long overdue (last decade).
But wins and loses…. why not talk about them? I know they are not a good measure of a pitcher’s worth but they do mean something,
Also please keep the save
Pitcher wins mean absolutely nothing. NOTHING!
Wins NEVER should have been used to evaluate pitchers. They were just as useless back in the day as they are now. Just because we didn’t realize that pitcher wins weren’t real stats back in the day of Young, Gibby and Drysdale doesn’t mean they were. I’m sure that even in those days there were great SP’s who played for sucky teams who had fewer wins than equivalent (or even inferior) pitchers who played for good teams.
And no. I don’t want to hear about “pitching to the score” or whatever it is.
I remember watching a baseball documentary and when they asked Gibson about his 1968 season, he went 22-9. He had a stretch in May where he got the L for 4 straight games even though he had an ERA under 2, kept opponents to a BA under .200 and had a 26/9 K/BB ratio. The most runs he gave up in a single game in that span was 3. Arguably his worst game of that season, he got the win. Baseball isn’t fair and even Gibson didn’t like wins and losses. He’d get upset when he got no run support and was dealt the loss.
A couple years back i had no problems sorting SIERA on Fangraphs. Today—i can’t do it to save my arse.. Tried to mimic how Tim sorted it, but i can’t even get it to show up as an option under batted ball or advanced. Can anyone help a brutha? Looks like Tim went: Leaderboards>Player stats> pitching and after that?
Nevermind–i got it!
I feel I’m a mix of old school/ new school on the stats… 40+ years of playing and 30+ years of coaching have given me mixed feelings. I do believe that Pitchers’ W-L record is an indicator of one thing… how good of a teammate he is. My teams always played better for great teammates. They knew they would get the pitchers;’ best effort, and anything less on their part was not acceptable.
One of my friends, who knows ‘real’ baseball inside and out, told me that 50 years ago. He said Seaver got more wins because the team knew that Seaver was their best chance of winning a game, at least in the early years.
LOL! Such ridiculousness. A pitcher doesn’t control what the offense does. And if the offense doesn’t put their best effort forward for a given SP because they like another SP better, they need to be fired.
I would continue to use K/9, BB/9, and K/W.
1-People are familiar with the numbers.
2-Isn’t K% dependent on BABIP? If the BABIP should be .300, and someone has a .330, doesn’t that decrease his K% without necessarily reflecting the fact that the pitcher is striking out the same amount of batters that he always did?
Your BABIP can affect the number of batters you face. But the percentage of batters faced that you’re able to strike out is still a skill that the pitcher controls.
Oh lord. I hate the way these kind of advanced stats have seeped into the public sector of this game to such an extent. I understand why it’s important for scouts and GMs to look at these kinds of stats to decide who to draft and sign and trade for. I don’t understand why journalists and broadcasters feel the need to trot this kind of crap out when it does exactly nothing to enhance the entertainment value of the sport, and are, at best, distracting from the actual product on the field, which *hint* should be the only thing that actually matters. Sports are entertainment venues. Not daily lessons in post grad statistical mathematics.
I mean, baseball has always been about the stats. But for a century the stats that mattered were stats that could be interacted with and understood in real time as a game was going on. In the days when there were no TVs and radios, you could open any paper and look at your team’s stats for the day and in five minutes know the who, what, when, where, why, and how of every player in every game. In those days the stats enhanced the fan experience, because they dealt with the only thing that ever matters in sports… who won and who lost and why.
And that’s where advanced stats have gone off. They try to predict a players performance based on looking at a cherry-picked set of skills in a vacuum, while ignoring the actual result on the field. I can’t speak for all fans but for myself I’m sick of my team bringing in players or sticking with players who aren’t very good, because some of their stats suggest they *SHOULD* be good. It’s not about what the skills say a players *SHOULD* be. It’s about what the players functionally *ARE* based on the results on the field. Sports aren’t about which team has the best skills. If that was the case they’d stop playing after 162 games and tally up all the stats and hand the trophy to the team with the best collective numbers. But that’s not what we do. We award the trophy to the team that’s best AT WINNING GAMES. Yet the stats are all about who *should* be best, rather than those who *are* best.
You know, I wonder whether in today’s world a guy like Jamie Moyer could even get a tryout. His velocity was non existent, other than Dan Uggla he never seemed to strike anybody out. On paper he’d look like a bad back of the rotation arm. But his real world results were to post ten season with an ERA under 4.00, two 20-win seasons, another three 15-or more win seasons, he was an all star and twice was top five in Cy Young voting. He was the best starter on several Seattle playoff teams and the second best starter on a World Champion Phillies team.
How many players like Moyer get passed over because their numbers don’t coordinate with their results, and in today’s world the numbers are more valuable than the result? How many players who win and are entertaining do teams let walk because their numbers aren’t as efficient as some dud from the minors who’s never seem big league competition? How many club houses are dysfunctional because all GMs do is collect stats rather than build teams. How much more entertaining would the sport be today if writers and announcers were talking about box score stats rather than spin rate, launch angle, the half dozen different ways they evaluate strikeouts versus walks, and the thirty-seven different versions of WAR which can’t even be coherently explained by the people who invented them?
It might be helpful to take a step back and look at the main purpose of this post, which is to explain why we switched to K% and BB%.
You talk about “daily lessons in post grad statistical mathematics,” but I am talking about a stat that is as simple to calculate as batting average. K% is literally strikeouts divided by batters faced.
A beef with something like WAR or SIERA is really an entirely separate thing.
I also think Jamie Moyer is very interesting. I think if he came along today, he would succeed in the Majors eventually. He was a sixth-round draft pick, so he kind of DID get passed over in the 1984 draft, 134 times. But eventually, skills like his control, durability, and possibly ability to generate weak contact would have won out the same way Kyle Hendricks forced his way into the picture.
I appreciate all the interest and feedback here. I intend to do some separate articles explaining further why we like to use some stats for evaluation and not others. And I should note that this is ever-evolving, so if it becomes apparent that some of my choices are flawed, I’ll re-evaluate them.
How to make a millennial go ballistic. Mention wins, batting average and RBIs (or hide their phone for an hour, or explain capitalism, etc).
Speaking as someone who does not belong to the millennial generation, pitcher wins are not real stats and need to go away.
One possible measure of the value of a statistic would be whether it tells you if one player is better than the other player. We can all think of examples when a .230 hitter outplayed a .280 hitter. Doesn’t mean BA is useless, but you have to look for other ways to rank them. That’s the holy grail, find ways to rank players.
Tim,
I’m fine with those changes, EXCEPT WHIP, which I find really useful. It gives us a sense of how controlled a pitcher is. I hope you’ll change your mind about that stat.
Is it just me or is SIERA overly weighted in favor of strike out heavy guys while pitch to contact guys are consistently undersold? Ryu, Hendricks, Keuchel, types seem to have consistently higher SIERA’s than their actual production while SIERA seems to think that Robbie Ray and Tyler Glasnow are better than they produce. It seems like some of the outcomes that SIERA attributes to luck are either actually skills in some players or those players are just consistently lucky. But it seems to be certain types that get under or over sold.
Keep WHIP around. It’s a pretty solid measure of a pitcher’s efficiency. One of the best in my opinion. In addition, I feel like way too much emphasis is put on strikeout numbers. Sure, it’s great to have guys with wipeout stuff… but it makes guys with elite command look average in many cases. I’d take Mark Buehrle over Trevor Bauer any day of the week, but that’s just me.
We have never used WHIP, so it’s not a matter of keeping it around.
I will elaborate in a separate post on why I don’t use it.
Correction…I do think I used WHIP a bit in 2005-06, the earliest years of MLBTR. And I’m sure some of our other writers have dropped it in once in a while. But it definitely has not been in regular usage here in the last 13 years or so.
I meant more from a context of using it in general as I’ve noticed that a few other sites/analysts have opted not to use WHIP, too. I just like WHIP as a measure of a pitcher’s qualities. What is the greatest knock on WHIP and what would you suggest as an alternative? Also, are there any legit categories that measure pitcher efficiency (particularly for starters). I just remember Yu Darvish a few years back would have massive K rates but would always seem to be at like 100 pitches in the fourth inning. Just wondering as that seems like something rather valuable.
The comments sound like coursework from “How to suck the joy out of baseball 101”.
Just admit that you’re too old or stubborn to understand new concepts and statistics.
Do you not hear what you sound like? You’re attempting to belittle me for being “old” (not sure how you know my age or what it is compared to your age) and for not understanding “stats”. I mean, come on, get yourself together my man.
I just don’t want you or old-school ballplayers to fall behind and disappear into irrelevance after baseball passed them by. I believe in you and your ability to learn new things and new statistics.
YOU CAN DO IT!
The “old way” is gone for good, and baseball has changed. The sooner you accept and understand algorithms and sabermetrics, the better off we all will be.
Please get a hold of yourself. Thanks.
How is Max Fried not on any of these lists? Were his peripherals much worse than his stats?
I’m okay with the change to K% and even BB%, but I still like the K / BB ratio much better than K-BB%. The ratio is great because “3:1” easily tells you that Pitcher XYZ strikes out 3 times the amount of batters than he walks; very informative. When it comes to K%, knowing that a pitcher strikes out 33% of the batters he faces is informative, as is an 8% BB rate, but when I see Pitcher XYZ has a K-BB% of 27, it really doesn’t tell me much.
I think the only stat that really matters is how many times the ownership calls a player a “fat toad”…….
Do you realize if we used this new k% to evaluate starting pitching, Greg Maddux would be way down on the list? His career strike out percentage was 16.5%. (He would be 37th in 2021 with a 16.5%) Guys like Melido Perez and Jason Bere annually beat him out. The reason is, Maddux pitched a lot of innings and relied on his defense. He didn’t strike out a ton of guys… Sure he’d get strike outs, but compared to today, his 6.1 K/9 would be a warning sign.
So, before all of you forget… Greg Maddux was a really good pitcher.
Another decent pitcher low on this list would be Don Sutton.16.5%
And Tom Glavine 14%
Randy Johnson was usually 1 or 2 on this list during this time… Roger Clemens… Pedro, Smoltz were around, so don’t say there were no strike out pitchers during this time. There were.
Oh, and for relievers… Mariano Rivera would be ranked around 100 in 2021 with his 23% strike out rate.
Rivera was a pretty good reliever.
When Maddux was at his peak, say 1992-2000, the NL average K% for a starting pitcher was in the 14-16% range. Mad Dog put up a 19% K rate during that time.
One thing you’re forgetting is that no one has suggested pitchers should solely be evaluated by K%. Walks, groundballs (ie HR allowed), and innings matter, too.
Maddux had a BB% of 4,1 during his peak vs the typical 8-9% for an SP. His control was third-best in baseball during that time.
While we don’t have GB% from that era, Maddux led all of MLB by allowing a HR against just 1.2% of batters. It was impossible to homer off him.
Maddux also led all MLB pitchers in total innings, averaging 7.29 per game. Pitching a ton of innings – that’s good.
As a result, Maddux led all MLB pitchers in WAR from 1992-2000. You’re using a straw man argument to come to the defense of a pitcher that sabermetrics absolutely loves. Even these very basic numbers can tell us why Maddux was the best in a way that you can’t.
Yes, Maddux was better than average. I agree. But guys like Melido Perez and Jason Bere had better k%… many times Maddux was ranked in the teens and even 20’s during this period. No way there were 20 starting pitchers better than him. I could see a Randy Johnson or Clemens beating him out… but Melido Perez? More than once even.
There is no singular stat that will rank the best players every time. That’s why we need to look at multiple stats to rank them.
The pitcher with the most wins isn’t necessarily the best pitcher… he just was awarded the most wins.
The pitcher with the best strike out percentage isn’t necessarily the best pitcher… he just strikes out more batters per plate appearance.
The pitcher with the lowest era isn’t necessarily the best pitcher… he just gives up less earned runs than everyone else.
Look at multiple stats to evaluate the best players.
Complete Games was a stat that has gone by the wayside. Back in the day, a good pitcher could get 20 complete games in a year. Nowadays, they might get 1 or 2. Scherzer has 11 total for his career. Kershaw 25.
Quality Starts was a stat that was kind of interesting. Pitch 6 innings, give up 3 or less runs a game. It measures what a decent outing would be… not a great outing. So it showed guys who were decent.