Headlines

  • Angels Acquire LaMonte Wade Jr.
  • Braves Designate Craig Kimbrel For Assignment
  • Corbin Burnes To Undergo Tommy John Surgery
  • Braves Select Craig Kimbrel
  • Jerry Reinsdorf, Justin Ishbia Reach Agreement For Ishbia To Obtain Future Majority Stake In White Sox
  • White Sox To Promote Kyle Teel
  • Previous
  • Next
Register
Login
  • Hoops Rumors
  • Pro Football Rumors
  • Pro Hockey Rumors

MLB Trade Rumors

Remove Ads
  • Home
  • Teams
    • AL East
      • Baltimore Orioles
      • Boston Red Sox
      • New York Yankees
      • Tampa Bay Rays
      • Toronto Blue Jays
    • AL Central
      • Chicago White Sox
      • Cleveland Guardians
      • Detroit Tigers
      • Kansas City Royals
      • Minnesota Twins
    • AL West
      • Houston Astros
      • Los Angeles Angels
      • Oakland Athletics
      • Seattle Mariners
      • Texas Rangers
    • NL East
      • Atlanta Braves
      • Miami Marlins
      • New York Mets
      • Philadelphia Phillies
      • Washington Nationals
    • NL Central
      • Chicago Cubs
      • Cincinnati Reds
      • Milwaukee Brewers
      • Pittsburgh Pirates
      • St. Louis Cardinals
    • NL West
      • Arizona Diamondbacks
      • Colorado Rockies
      • Los Angeles Dodgers
      • San Diego Padres
      • San Francisco Giants
  • About
    • MLB Trade Rumors
    • Tim Dierkes
    • Writing team
    • Advertise
    • Archives
  • Contact
  • Tools
    • 2024-25 MLB Free Agent List
    • 2025-26 MLB Free Agent List
    • 2024-25 Top 50 MLB Free Agents With Predictions
    • Projected Arbitration Salaries For 2025
    • Free Agent Contest Leaderboard
    • Contract Tracker
    • Transaction Tracker
    • Agency Database
  • NBA/NFL/NHL
    • Hoops Rumors
    • Pro Football Rumors
    • Pro Hockey Rumors
  • App
  • Chats
Go To Pro Hockey Rumors
Go To Hoops Rumors

Predicting Tommy John Surgeries: The 2017 Update

By bwoodrum | September 29, 2017 at 3:15pm CDT

Background

For 130 years, pitchers have thrown a baseball overhand, and for 130 years, doing so has hurt them. Starter or reliever, left-handed or right-handed, short or tall, skinny or fat, soft-tossing or hard-throwing, old or young—it matters not who you are, what color your skin is, what country you’re from. The ulnar collateral ligament (UCL), a stretchy, triangular band in the elbow that holds together the upper and lower arms, plays no favorites. If you throw a baseball, it can ruin you.

-Jeff Passan, The Arm: Inside the Billion-Dollar Mystery of the Most Valuable Commodity in Sports (Amazon link)

In February 2016, I presented my Tommy John surgery predictability findings from a half year of studying pitching, injury, geographic, and physiological data from thousands of Major League Baseball player-years. The results were simple and largely intuitive: Throwing really hard is dangerous for your elbow, doubly if you recently hurt your elbow.

After another year and a half of work, I’m proud to present an update to my injury research, and while the takeaway this year is perhaps more vague, the effectiveness of the model is more certain. Without further ado (the further ado section comes later), I present the results.

Results

The following table presents the Tommy John Surgery risk for MLB players entering the 2017 season, as well as the 2018 given 2016 through October 2017 data.


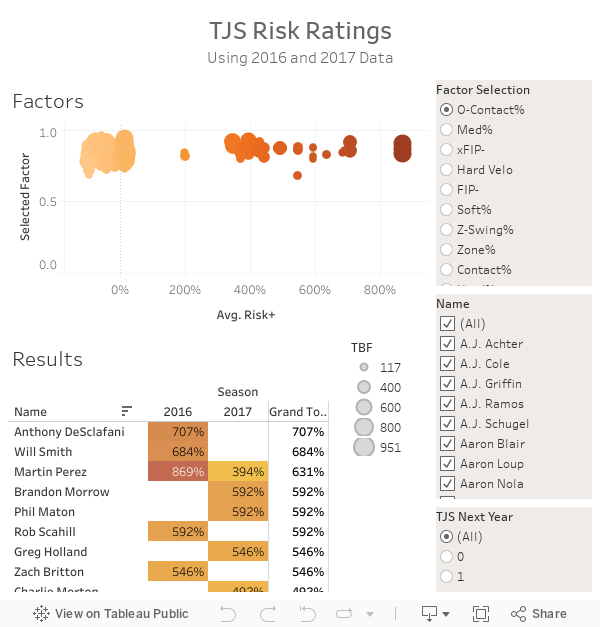
Risk+ is the player’s percentage above or below average the predicted TJS Power (explained below) score. The average TJS Power score is about 0.3, so a player with a 0.6 prediction would have a Risk+ of 100%. Link to standalone Tableau.

Because of playing time limits, some players will not appear in a 2016 or 2017 column even if they pitched in the given year. It is important to note that the 2016 column is estimating the pitcher’s TJS risk given his data from the 2016 season. So 2016 predicts a 2017 injury. The 2017 data predicts injury risk given the (partial) 2017 data, thus striving to predict a player’s injury risk heading into the 2017 playoffs and 2018 season.

Read more

Analysis

At first, the results from the previous TJS study appeared quite promising (if we can define a catastrophic injury as “promising”). Carter Capps, on March 8, 2016, became the first major leaguer of the 2016 season to have season-ending Tommy John Surgery (TJS). Carter ranked No. 10 on my list of high-risk pitchers (with 156% risk above average or Risk+) going into the season.

When word reached me that Capps was going under the knife, my stomach sank. Part of me hated doing research that might negatively impact a person’s career, their reputation, and their confidence — especially if the predictions proved unreliable. Another part of me feared my predictions might be correct, and my work might not lead to better injury prevention, but rather a hangman’s march of certainty.

It is my hope that any tidbits of information I have uncovered with this ongoing effort will pay dividends in reducing arm injuries, though that is a task that will necessarily occur on the other end of this baton.

As the season went along, the real-world results of the research oscillated between successful and questionable. In early April, Manny Parra (-48% Risk+) succumbed to TJS. Four days later, another unlikely candidate, Felix Doubront (-75% Risk+), got the bad news. Then Chris Bassitt (5% Risk+) and Carson Smith (35% Risk+) went down.

All told, from February 2016 through August 2017, the players who fared worse in reality had higher risk rates in the formula:

Had TJS in 2016? Average of Risk+ Number of Players
FALSE -2% 410
TRUE 26% 25

Astute readers will note that 921 pitchers took the mound since Opening Day 2016, not the 435 that are observed above. This is in part due to sampling data size requirements that might forever hinder this kind of research until complete, accurate, and public minor league PITCHf/x data exists.

Where this leaves us now is looking for room to improve. After almost two years of continuous work — cleaning data, writing code, updating data, re-rewriting code, giving up three times, receiving divine inspiration four times, and updating the data again – I am proud to present a revised model that I believe improves upon the model, and improves it considerably.

Using the same input time frame – the years 2007 through 2016, in order to predict UCL injuries in a random subset of that group – I have found an algorithm producing these results:

Had TJS in Following Year? Average of Risk+ Number of Players
FALSE -3% 1104
TRUE 90% 40

First, let’s start with what we believed was working with the last model:

There were some relative surprises, but also some intuitive ideas. Being old lessened the odds of TJS (though not hugely, and possibly because retirement or ineffectiveness is just as likely to hit the following season, especially if an elbow is already barking). Also, throwing fastballs was more dangerous than breaking balls, a finding confirmed in other studies, but not in baseball convention. Being left-handed seemed to matter, for the better, though the impact was small.

What mattered a great deal, and what makes the most intuitive sense, is the presence of recent arm trouble. This variable not only proved to be a reliable predictor of future Tommy John surgery (TJS), but also the most powerful (an important concept in good modeling). This is why, at the close of my article, I bemoaned the issues that plagued my limited injury and PITCHf/x database:

Without comprehensive dumps from the PITCHf/x data at Brooks Baseball or the Baseballic.com injury database, and without good information on late-career UCL injuries that result in retirement instead of TJS, and without medical records from these players themselves, we will always be playing catch-up with our prediction models.

This year, I am happy to announce we managed to lease data from Corey Dawkins’ baseballic.com database. Some may remember Dawkins for his work adding granular injury data to the player pages at Baseball Prospectus. And while that impressive dataset only spanned several recent seasons, the data available at baseballic.com extend as far back as the 1980s in some cases and all the way up to present day. It is the most impressive baseball injury database outside the server rooms of the Major League teams.

Add to that, in June 2017, FanGraphs added the superb Pitch Info data – the heart of the Brooks Baseball PITCHf/x data – to their filterable and downloadable leaderboards. These two developments were nothing short of a breakthrough for this research, and specifically, it caused a major change to the model:

Previous injury history began to matter less. Intuitively, this does not make sense. One would think a previous arm injury – which is going to necessarily decrease the arm’s ability to resist future injuries – should lead to possible UCL injuries. And while that still may be the case, the model could not find a consistent relationship with previous arm injuries and the specific UCL injury. Previously, I found that when I combined the injury database classifications for wrist, forearm, elbow, and shoulder injuries into a single bucket, they loosely forecast a UCL injury – but I had previously found the same injury database confusing a broken leg with a UCL injury. Since it was programmatically scraped from disabled list feeds, and not edited or reviewed after the fact, it was liable to have a number of UCL or even Tommy John events misclassified as elbow tightness or a shoulder injury – especially if a player initially hit the DL for something other than the eventual TJS.

So in other words, it’s quite possible that the old injury database was catching self-fulfilling prophecies. Joe Pitcher hits the 15-day DL and 30 games in 2011 with forearm tightness. Turns out, he needs TJS in the offseason. So he misses 2012 with TJS, even though his UCL blew up in 2011. A simple DL scraper is not going to catch that nuance – and since I’m most interested in finding out in 2010 that Joe Pitcher is going to have elbow fireworks in 2011, bad DL data undermines that effort enormously.

All this to say: Injury history did not play into this model.

There are 19 factors in total within this model, and they are:
TJS Input Correlations
There are three important points of interest here: 1) The four different risk quartiles all sit fairly closely to each other, and the correlation with following-year TJS is – at its strongest – quite low. Extremely low. We need to remember that if there were obvious, intuitive connections to UCL injuries, we would have already found them. The connections here are all loose, complicated, and non-linear.

2) That said, the low-risk group has a lot of yellow boxes – meaning they have the most middle values of the three groups. They led the pack in vertical release point standard deviation (vert_stdev), and they threw the ball the hardest (HardVelo), though not by much (0.2 mph faster than the middle group). That is especially curious because previous model suggested fastballs were bad for an elbow’s overall health, and here we see guys with electric fastballs disconnecting from TJS risk. One possible explanation is that, when healthy, fastball velocity is up, and when hurt, it dips lower. This makes a compelling case for examining velocity changes too, and that is the next area I intend to push this inquiry (even though it showed little value in the previous study). But other than that, the low-risk group mostly fell between the two other risk groups. They barely had the worst xFIP-, but barely had the second best FIP-.

3) The high-risk group had a lot of soft-tossing inning-eaters. It is important to remember that relievers and starters are mixed together here, as well as pitchers who pitched partial seasons. Starters, by the very merit of pitching more innings, are logically at a higher risk of UCL (and all other) injuries, but since many injury-prone starters end up in the bullpen, it is not necessarily an obvious linear relationship. In fact, the medium risk group threw fewer innings than low risk group.

However, the average fastball velocity for the high-risk group was over a full mph slower than the next closest group. They also struggled to induce whiffs out of the zone, leading the group in out-of-zone contact rates (O-Contact% (pi)). Taken altogether, the model seems to suggest that pitchers who did not have great fastballs, but used them consistently and ate innings were at higher risk of TJS.

Speaking in these kinds of generalities, of course, does little good when we look at the actual list of high-risk players forecast in 2017 – with names like Andrew Miller, Kelvin Herrera, and Zach Britton in the highest-risk groups. Consider this an emphasis on how the actual model is exploring non-linear relationships. At minimum, the model is… complicated:

TJS Risk Model

Grueling Math Details

The previous model employed linear regression, with “TJS Power” as the dependent variable. I devised TJS Power when thinking of a way to test for red flags in the years leading up to a UCL injury rather than the single year preceding the event. For the five years leading up to a UCL tear, I assigned the pitcher a numerical value counting up to the year before the injury. So, 2012 Gavin Floyd — who would go under the knife May 7, 2013 — had a TJS Power of 5. His 2011 season had a TJS Power of 4, and so on until he reached 0 back in 2007. For players that would never have TJS, they received a 0 across all years.

There are certainly flaws in this methodology, but the guiding principle in my research is: “It has to work.” To borrow a phrase from Ben Lindbergh and Sam Miller’s 2016 book of the same title: The only rule is it has to work. And from what I can tell, the TJS Power method works.

Believing the TJS Power method helped a great deal in the previous project, I continued using it. The wrinkle I added – beyond the vastly improved data – was changing the simple linear regression into a tree of regressions, specifically a classification and regression tree (CART). The methodology creates a massive decision tree based on linear regressions and allows the machine learning algorithm to find non-linear relationships that might otherwise elude us.

It comes with its risks – and I’m sure some machine learning experts spit coffee on the monitor when they saw my enormous tree above. One of the biggest dangers of this method is over-fitting – allowing the algorithm to find minute and inconsequential variables with minimal correlations and make them into bigger deals than they are in reality. For instance, at one point in the model, the tree splits based on Total Batters Faced (TBF), and those who saw greater than 823 TBF were then further split based on how many innings they had pitched (IP). Since IP and TBF measure almost the same thing, it is hard to understand why or how such a hair-split would be useful or meaningful.

The effect of overfitting is diminished predictive power, but the model was derived with a random subset of the data and tested against a separate subset (representing a third of the pitchers in my 2007 through 2005 database). This represents the predictive power presented above – a 90 percent above average risk rate. I then used the same model to test against what 2017 UCL injuries have already occurred, and I got the following result:

Had TJS in 2017? Average of Risk+ Number of Players
FALSE -4% 427
TRUE 144% 11

So far, it appears to follow the platinum rule: It works. But since the model is attempting to forecast TJS injuries in the following five years, it merits continued study and improvement. One concern I have is the volatility in year-to-year Risk+ rates. Pitchers — who on surface do not change their results considerably from one year to the next — can bungee from high risk numbers to minimal risk. Did they make just the right changes to their pitch mix, innings totals, and contact rates to ease the pressure on their UCL? Apparently so.

But what does that one year of high risk mean for the following years? In theory, the latest model results should reflect the current reality. But logic suggests a full year of abuse on the UCL is still a full year of abuse. Eventually, that should create problems, even if the pitcher’s current pitching approach has a lower risk rate.

Players

Let us take a moment to examine some of the specific players identified here.

  • Anthony DeSclafani tops the list with the worst average Risk+ rating at 707% above average (a predicted TJS Power of 2.5). While that is not the highest single-season Risk+, it is noteworthy because he had no 2017 data to pull that high number down. Why? Because he has missed the whole season with elbow tightness, later diagnosed as a UCL strain. While he has not undergone TJS, it appears the model correctly predicted his impending elbow troubles.
  • If you click the “1” button under the “TJS Next Year?” filter in the Tableau embedded above, you will find the list of players who underwent TJS in this 2017 season. Looking at their projected risk using the 2016 numbers, we see the model was very correct on Michael Pineda, Joe Ross, and Will Smith. It missed big on Drew Storen, Edinson Volquez, Shelby Miller, and Trevor May. This is worth reinforcing the idea that (a) the model will certainly miss a lot, but (b) it should ultimately hit better than it misses.
  • When you filter “1” on the “TJS Next Year?” section, you will also note none of the 2017 season predictions appear. That is because they use 2017 data to predict 2018 injuries — which have not yet happened.
  • Jeff Samardzija had one of the worst Risk+ numbers from the 2016 data, but his 2017 data suggests below-average risk. Looking at this pitch repertoire, he has thrown way fewer four-seam fastballs and cut fastballs this season, pushing his curveball across the plate at almost a 15% rate, according to Pitch Info stats. In 2016, he threw curves at a rate of 8%. He has also allowed less medium-strength contact, though I still struggle to find the intuitive connection between hitter contact strength and pitcher elbow injuries.
  • That weirdo R.A. Dickey — who physically lacks a UCL in his right elbow — has been stricken from all the data, and did not influence the construction of the model.
  • Martin Perez has earned two grim predictions in consecutive years. If I could persuade anyone to get a precautionary MRI or see a doc, it would be the Rangers’ lefty.
  • Chad Green throws — almost exclusively — a 95 mph fastball. I would intuitively think he’s at risk of TJS, but the model assures me he’s the paragon of good elbow health. Maybe the model has discovered he’s an easy gas type, the sort of fellow who doesn’t have to work hard for his fastballs. I don’t know. But he ranks as the safest player on the list, and therefore the canary in the coalmine. If Green gets a UCL tear, it bodes quite poorly for the model.

Next Steps

While the development of this model spans almost two full seasons and an offseason, the late addition of Pitch Info data — and the ever growing wealth of on-field data — means there are still many rocks to turn over. If hitter contact truly does foresage TJS, as the model here suggests, then HITf/x and FIELDf/x data might also provide greater clarity into future UCL injuries. Adding minor league PITCHf/x data would more than quadruple our dataset, too, and could provide powerful weight to the model, as well as possibly unlock knowledge about young players suffering from UCL injuries.

Also, even the data used in this dataset can be further spliced and prodded — looking at repertoire changes, velocity and movement changes, and so much more. The truth is an infinity of variables can and should be tested in the blank-slate vacuum of a new model. Until we can predict UCL injuries better than tomorrow’s weather, there is no variable too bad to be left off the table.

More specifically, biometric data — accurate heights and weights, fluctuations in year-to-year weight, bench press maxes, long jump numbers, stretching and flexibility measurements — all deserve examination. Unfortunately, none of that data exists in the public sphere, or possibly at all.

Another room for improvement, and something I hope to test more thoroughly next year, is the use of neural networks and other machine learning mechanisms that might uncover further non-intuitive connections to Tommy John Surgery. There are many risks with moving further from human hands and into the cold efficiency of machine learning. For one, we risk losing the “lesson,” so to speak. Last year, it appeared obvious that throwing lots of fastballs after recent arm injuries increased injury risks. This year, the moral of the story is more hazy.

But these advanced techniques deserve consideration because, frankly, our intuition has failed to predict these injuries. And if we truly want to improve our treatment and prevention of these injuries, we first need to accept that the only rule is that it has to work.

A big, enormous thanks to Corey Dawkins from baseballic.com for opening the storehouse of his injury database to us. Also, a big thank you to FanGraphs’ ongoing support of free, publicly available baseball data. They pay a pretty penny for data from BIS, Pitch Info, and the like. Research like this is not possible without it. A thanks to Jeff Zimmerman and Jon Roegle for hosting and updating their respective injury and TJS databases.

Share 0 Retweet 6 Send via email0

MLBTR Originals Newsstand

26 comments

Predicting Tommy John Surgeries

By bwoodrum | February 23, 2016 at 12:25am CDT

From Derick Velazquez in January to Lance Lynn in November, there were 112 ulnar collateral ligament (UCL) injuries requiring reconstructive surgery — commonly called Tommy John Surgery (TJS) — in the 2015 season. Once a career-killer, UCL injuries have become a much more survivable injury over the last 30 years. And while more and more players are successfully returning from TJS, the procedure itself is a catastrophic event and requires a minimum of a year to recover.

That makes predicting UCL injuries a valuable and worthy endeavor. From the GM to the fantasy owner, being able to steer away from players with early warnings signs of UCL injuries can save a team’s season. The red flags for UCL injuries are not big, though, and many UCL injuries appear from nowhere. But using a large data set, culled from a variety of valuable resources, we can find the tiny red flags, the little baby red flags.

For the past seven months, I have been working with Tim Dierkes and his staff to develop a model to predict Tommy John surgery. The creation of this model required, quite literally, hundreds of thousands of lines of data and hundreds of man hours to combine and connect and test data from a variety of disparate sources. The project also took, as a sacrifice, one of my computer’s CPUs, which burned out shortly after completing some herculean computations. Fare thee well, i7.

[For further details on the process, results, and limitations of this study, please refer to Bradley’s MLBTR Podcast appearance and MLBTR Live Chat.]

The Results

The following is an attempt to quantify the risks that foreshadow potential UCL injuries. It is a combination of FanGraphs player data, Jeff Zimmerman’s DL data, PITCHf/x data, a bunch of hard work, and the keystone data: Jon Roegele’s TJS data, as stored on Zimmerman’s Heat Maps. We also checked our numbers against Baseballic.com, which houses arguably the most comprehensive injury data online.

And while most efforts at quantifying TJS risk have focused on recent appearances or recent pitches, our research takes a step further back and examines injury risks on an annual basis. It seeks to consider the problem from the GM’s view, and not the game manager’s.

The following names are sorted by greatest risk to least. For more details about the columns and the model that has created this data, continue reading after the embedded data.

Top-Bot

Click Here for Interactive Tableau and Full Results

The results include three terms that help define where the players fit:

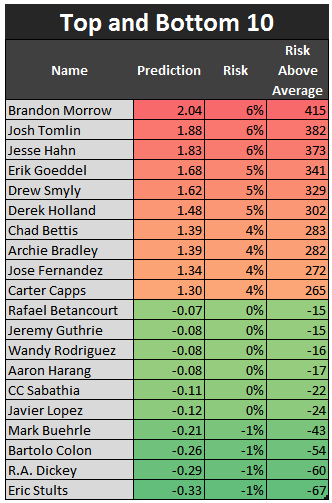
  1. Prediction: My method of regressing the variables against pending TJS events resulted in a scale of 0 to 7, where 7 is the season before a player undergoes TJS. So our top player above, Brandon Morrow, ranks a 2.04 out of 7.00, meaning he is nowhere near a player about to absolutely have a shredded UCL. But it is certainly above average.
  2. Risk: This is the player’s prediction, divided by the highest possible result, 7. Then, I then multiply the result by the degree of confidence I have in the model, which is the R^2 of .22. R^2 is the statistical tool for checking how much the model explains the variation in the data. It is unconventional to multiply the regression result against the R^2, but I wanted to firmly assert that this model can only explain — at most — 22% of the variation we find in the TJS population. I have additionally listed the results as whole numbers in an effort to limit the perception of precision that a decimal place conveys.
  3. Risk+: This is merely a representation of how far above average or below average the player’s risk is. Here, 0% indicates a league-average risk; 100% is 2x the league average; 200% is 3x, and so on.

The Raw Numbers section includes the specific variables involved (explained in further detail in the “The Inputs” section). The Indexed Section includes the same data, but indexed (unless it is binary). That means the average is 100, twice the average is 200, and so on. This is the same as wRC+ or OPS+ or even Risk+, minus the % sign and with league average at 100 instead of 0%.

The Inputs

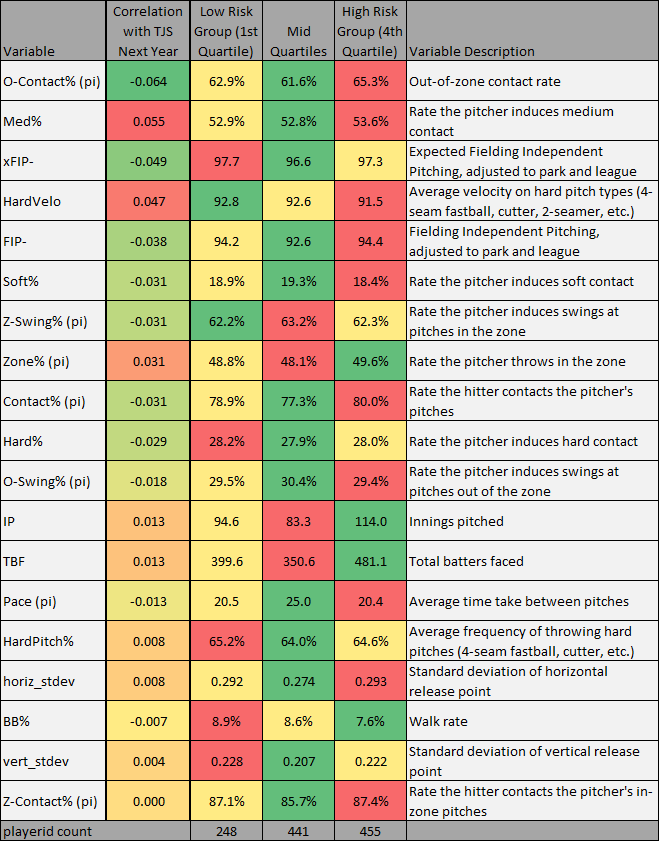
Over the preceding months, I have tested, prodded, and massaged many numbers. These were the factors that ultimately proved to have the strongest, most consistent relationships with impending TJS:

    1. LHP = 1: MLB pitching staffs have been 28% left-handed since 2010. TJS victims are 25% left-handed. Throwing the ball with your right hand — unlike Tommy John, the original — is the first tiny red flag.
    2. St. Dev. of Release Point: Previous studies (such as here and here) have attempted to connect release point variations with injuries. In the various models I created, release point had a consistent, while small, predictive power. I did not control for whether or not the pitcher appeared to have a deliberate difference in release points (as in, guys who pitch from multiple arm slots), but the infrequency of that trait does not seem to impact the variable.
    3. Days Lost to Arm/Shoulder Injury in 2015: After many different permutations of what constitutes “an injury” or an “arm,” I landed on this unusual definition of an arm/shoulder: It’s everything from the wrist back, including the elbow, shoulder, and — why not — the collarbone. So it’s basically the principle upper-body actors of the throwing motion. No fingers, no legs. So if a player injured this arm/shoulder/collarbone area, the sum of their missed days has a decently-sized red flag planted on it. This is among the most important predictive factors for TJS — which makes intuitive sense. Previous injuries could be a forewarning of a bigger injury, or it could be a contributing factor in creating an UCL injury as pitchers compensate for a tweak or a partially-recovered injury.
    4. Previous TJS?: This is a count of how many times the pitcher has gone under the knife. While only a small percentage of pitchers have Tommy John Surgery in their career, it strongly predicts a second surgery. Since 2010, there have been 10,000+ pitchers in the majors and minors combined. In that time, about 560 pitchers in the minors and majors have had TJS, and 57 were repeats. So the ratio of MLB and MiLB players to TJS victims is about 5%, but the repeat rate is over 10%. In other words, TJS begets more TJS.
    5. Hard Pitches: This variable is the sum of four-seam fastballs (FA), two-seam fastballs (FT), and sinking fastballs (SI) as categorized by the default (MLBAM) PITCHf/x algorithm. Various attempts to include different pitch types and pitch counts all proved inferior to just a raw count of the hardest three pitches that the PITCHf/x database records.
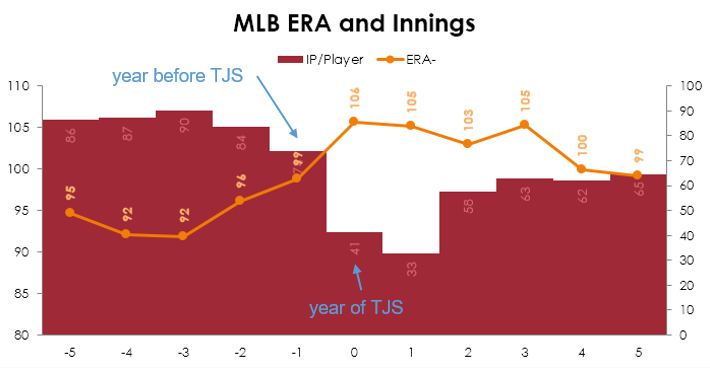
    6. ERA-: This is a park-, league-, and era-adjusted ERA, as reported by FanGraphs. This is the most puzzling part of the model, and the part I am least comfortable about, but a good ERA- (below 100) correlated weakly but negatively with good health. Possible bad data aside, the only theory I can muster to explain this is the idea that pitchers in the middle of good years are more likely to pitch on short rest or make emergency relief appearances in extra-inning games or key late-season games. The elite closer is more likely to pitch the three-consecutive-days marathon than the struggling middle reliever.
For some reason, there appears to be a connection between good ERAs and increased chances of TJS.
  1. Age: Here is another iffy variable. Why do older guys without a previous TJS have fewer Tommy John Surgeries? Well, for one, there are fewer older pitchers than younger pitchers, but even after we control for that, we see fewer 38-year-olds going under the knife. The reason is probably that fewer late-career guys see a major UCL tear as worth trying to overcome, and instead call it a career. Few can forget the end of Ramon Ortiz’s 2013 season, when the then-Blue Jays starter suffered what appeared to be an UCL injury and left the field in tears. Many assumed the 40-year-old righty would end his career then, but Ortiz was fortunate enough to avoid a UCL tear and managed to pitch in Mexico as recently as 2015. Had the 2014 injury been an UCL tear, Ortiz may have just ended his career then. There is also some survivor bias in here. Guys with truly durable UCLs are more likely to make it to their age-35 seasons (and beyond).

Here is a breakdown of the variable and coefficients involved:

Coefficients Standard Error P-value
Intercept 1.6319 0.27 0.00
Average of LHP? -0.1847 0.07 0.01
Avg Arm Slot STDDEV 1.6667 0.54 0.00
Arm/Shoulder? 0.0110 0.00 0.00
Previous TJS? 0.2981 0.07 0.00
Hard Pitches 0.0001 0.00 0.15
ERA- -0.0020 0.00 0.04
Age -0.0524 0.01 0.00

It is important to remember that the coefficients here do not visibly represent the strength of each variable because they each use a different scales. For instance, the largest Previous TJS is 2, but the largest Hard Pitches number is 2,488. (That said, Previous TJS is a much more predictive variable.)

P-values, in short, are the probabilities that the given variable is actually meaningless. Traditionalist might bristle at some of the P-values involved there. I personally find the customary cut-off P-values of .10, .05, or .01 artificial and unnecessarily limiting. Others are welcome to disagree.

Why is Player X So High/Low?

So your favorite pitcher is Brandon Morrow, and you’re distressed to see him top the charts here. Let’s look at why:

  • In 2015, Morrow missed 155 days after having debris removed from his shoulder. That’s 22x the league average among pitchers that completed at least 30 innings. No other pitcher on this list missed more days. (The average time missed was a little under 7 days.)
  • And despite missing most of the year, he still managed to throw a large amount of fastballs because, as Brooks Baseball puts it, he “relied primarily on his Fourseam Fastball (95mph) and Slider (88mph)…” Morrow threw his fastball almost 60% of the time in 2015.
  • Lastly, he is just barely on the wrong side of the average age of this group. While the age variable is still an odd one, it is important to keep in mind that TJS culls the herd in the early years. If Morrow were 36 and coming off an injured season of this magnitude, he would still probably be the most likely TJS candidate, but he’d get a few bonus points for proving his UCL could have lasted this long in the first place.

I am pleased to see the likes of R.A. Dickey, Mark Buehrle, and Bartolo Colon at the bottom of the list. They are older pitchers with incredibly steady release points and no recent injury history (Dickey, of course, doesn’t have a UCL in the first place, though obviously the statistical algorithm in question doesn’t take such factors into consideration. We left his name in the results regardless of that fact, for those wondering why, as a means of illustrating the type of pitcher likely to rank low on the list). Of course, these guys, at their age, are perhaps even more likely to be ineffective and retire mid-season than they are to suffer a catastrophic injury, but that is neither here nor there.

Free agent Tim Lincecum also makes the list, and in a very positive way with a risk that is 51% below the league average. While any GM or fantasy owner looking into a Lincecum 2016 season will no doubt be aware of his injury history, it is a great sign for the two-time Cy Young winner hoping to move forward in his likely-post-Giants career. The strongest contributing factors to Lincecum’s risk, however, are his inconsistent release point and the fact he makes a living off mixing up four generally slower pitches. While he has not shown great effectiveness in the past four seasons, avoiding TJS could buy him enough time to find a rhythm with his greatly decreased velocity.

Young Marlins ace Jose Fernandez only missed 35 days due to a biceps issue — if we don’t count the 97 days he missed recovering from TJS in 2015 — but that previous elbow operation combined with his young age suggests he is at greater risk of a second TJS heading into 2016. Again, we need a caveat here to remind us that age, while a predictor of TJS, may not be a good predictor of UCL tears.

Mark Buehrle, Bartolo Colon, and Eric Stults all have negative risk rates. Does that mean they are growing additional ulnar collateral ligaments? Yes. Almost certainly.

Rejected Variables

There are a few variables not included that might seem intuitive or necessary to include, but ultimately did not make the cut:

  1. Velocities: Early versions of this model included pitch velocities, but it became apparent after later revisions that pitch velocities — at least given the present variables — was serving as a poor proxy for the number of hard pitches thrown. It follows that guys with fast fastballs throw those fastballs frequently. Take, for instance, freshly Rockie’d reliever Jake McGee, who has a scintillating fastball and rumors of maybe another pitch. Throwing hard may not actually lead to elbow injuries, but throwing a LOT of hard pitches might.
  2. Other Pitch Frequencies: Throwing breaking stuff did not seem to have a meaningful relationship with TJS events — at least above and beyond the relationship with hard pitch totals. That does not mean sliders might not result in shoulder injuries or knuckleballers don’t have more fingernail issues, but in the given sample, with the given scope of our investigation, breaking and off-speed pitches did not create meaningful relationships.
  3. Altitude of Home Park: Despite the considerable effort it took to match up each player’s home park with their park’s altitude, this attribute appears to have no effect on TJS. One might suspect that environmental issues impact the prevalence of certain injuries, but we can cross off altitude for now.
  4. Non-Arm Injuries: I figured leg injuries — given how important legs are in delivering a pitch — or general injuries might have a connection to TJS if in no other way than causing inconsistency in the pitcher’s delivery or release. But once we add in the arm/shoulder injury days into the calculation — along with previous TJ operations — the value of other injuries goes away.
  5. Injuries in Previous Seasons: Despite connecting players up with five years of injury history, the unstable relationships (i.e. high P-values) also came with negative coefficient — suggesting an injury in 2013 makes you stronger against a possible UCL injury in 2015. That makes no sense.

Room for Improvement

Without comprehensive dumps from the PITCHf/x data at Brooks Baseball or the Baseballic.com injury database, and without good information on late-career UCL injuries that result in retirement instead of TJS, and without medical records from these players themselves, we will always be playing catch-up with our prediction models. If I am a team considering one of the players listed above, I would defer to medical and pitching experts opinions following a thorough medical examination.

But from our perspective, from the data available in the public sphere, these are the best, strongest tiny red flags I could find. And I hope and expect they will push this field forward. If you’d like to discuss my Tommy John research further, check back at MLBTR at 7:30pm central time, as I’ll be doing a live chat.

A special thanks to Jon Proulx who helped do some very boring data work with me!

Share 95 Retweet 44 Send via email0

MLBTR Originals Newsstand

85 comments

Live Tommy John Research Chat With Bradley Woodrum

By bwoodrum | February 22, 2016 at 7:15pm CDT

Click here to join tonight’s chat with Bradley Woodrum to discuss his recent findings on Tommy John Surgery.

Share 3 Retweet 3 Send via email0

MLBTR Chats

1 comment

ad: 300x250_1_MLB

    Top Stories

    Angels Acquire LaMonte Wade Jr.

    Braves Designate Craig Kimbrel For Assignment

    Corbin Burnes To Undergo Tommy John Surgery

    Braves Select Craig Kimbrel

    Jerry Reinsdorf, Justin Ishbia Reach Agreement For Ishbia To Obtain Future Majority Stake In White Sox

    White Sox To Promote Kyle Teel

    Sign Up For Trade Rumors Front Office Now And Lock In Savings!

    Pablo Lopez To Miss Multiple Months With Teres Major Strain

    MLB To Propose Automatic Ball-Strike Challenge System For 2026

    Giants Designate LaMonte Wade Jr., Sign Dominic Smith

    Reds Sign Wade Miley, Place Hunter Greene On Injured List

    Padres Interested In Jarren Duran

    Royals Promote Jac Caglianone

    Mariners Promote Cole Young, Activate Bryce Miller

    2025-26 MLB Free Agent Power Rankings: May Edition

    Evan Phillips To Undergo Tommy John Surgery

    AJ Smith-Shawver Diagnosed With Torn UCL

    Reds Trade Alexis Díaz To Dodgers

    Rockies Sign Orlando Arcia

    Ronel Blanco To Undergo Tommy John Surgery

    Recent

    Angels Acquire LaMonte Wade Jr.

    Blue Jays Recall Spencer Turnbull For Season Debut

    Orioles Notes: Westburg, Mullins, O’Neill

    Tigers Notes: Vierling, Olson, Urquidy, Boyd

    Twins Place Zebby Matthews On 15-Day IL, Reinstate Danny Coulombe

    Yankees Claim CJ Alexander

    Phillies Claim Ryan Cusick, Designate Kyle Tyler

    Brewers Claim Drew Avans

    White Sox Sign Tyler Alexander, Place Jared Shuster On 15-Day IL

    Orioles Designate Matt Bowman For Assignment

    ad: 300x250_5_side_mlb

    MLBTR Newsletter - Hot stove highlights in your inbox, five days a week

    Latest Rumors & News

    Latest Rumors & News

    • 2024-25 Top 50 MLB Free Agents With Predictions
    • Nolan Arenado Rumors
    • Dylan Cease Rumors
    • Luis Robert Rumors
    • Marcus Stroman Rumors


    Trade Rumors App for iOS and Android

    MLBTR Features

    MLBTR Features

    • Remove Ads, Support Our Writers
    • Front Office Originals
    • Front Office Fantasy Baseball
    • MLBTR Podcast
    • 2024-25 Offseason Outlook Series
    • 2025 Arbitration Projections
    • 2024-25 MLB Free Agent List
    • 2025-26 MLB Free Agent List
    • Contract Tracker
    • Transaction Tracker
    • Extension Tracker
    • Agency Database
    • MLBTR On Twitter
    • MLBTR On Facebook
    • Team Facebook Pages
    • How To Set Up Notifications For Breaking News
    • Hoops Rumors
    • Pro Football Rumors
    • Pro Hockey Rumors

    Rumors By Team

    • Angels Rumors
    • Astros Rumors
    • Athletics Rumors
    • Blue Jays Rumors
    • Braves Rumors
    • Brewers Rumors
    • Cardinals Rumors
    • Cubs Rumors
    • Diamondbacks Rumors
    • Dodgers Rumors
    • Giants Rumors
    • Guardians Rumors
    • Mariners Rumors
    • Marlins Rumors
    • Mets Rumors
    • Nationals Rumors
    • Orioles Rumors
    • Padres Rumors
    • Phillies Rumors
    • Pirates Rumors
    • Rangers Rumors
    • Rays Rumors
    • Red Sox Rumors
    • Reds Rumors
    • Rockies Rumors
    • Royals Rumors
    • Tigers Rumors
    • Twins Rumors
    • White Sox Rumors
    • Yankees Rumors

    ad: 160x600_MLB

    Navigation

    • Sitemap
    • Archives
    • RSS/Twitter Feeds By Team

    MLBTR INFO

    • Advertise
    • About
    • Commenting Policy
    • Privacy Policy

    Connect

    • Contact Us
    • Twitter
    • Facebook
    • RSS Feed

    MLB Trade Rumors is not affiliated with Major League Baseball, MLB or MLB.com

    hide arrows scroll to top

    Register

    Desktop Version | Switch To Mobile Version