
Athletics In Advanced Trade Discussions
8:14pm: Then again, it is obviously possible that multiple deals are in the works, and Rosenthal further tweets that the team is in talks on multiple trades, with a source saying that GM Billy Beane is “re-working the club.” (Twitter link.)
Slusser, meanwhile, tweets that ten teams have expressed interest in Samardzija, including the Red Sox and White Sox, but that he does not appear to be in any deal nearing completion.
8:05pm: Oakland is negotiating a deal but it does not involve Samardzija, tweets Ken Rosenthal of FOX Sports. Neither is Brandon Moss involved in the chatter, per MLB.com’s Jane Lee (via Twitter).
7:41pm: The Athletics may be closing in on a trade involving starter Jeff Samardzija, reports Susan Slusser of the San Francisco Chronicle (Twitter links). Oakland would receive several players in return, per Slusser, with the focus being on acquiring bats.
Samardzija is projected to earn $9.5MM in his final year of arbitration. The righty had a breakout 2014 campaign, posting a 2.99 ERA over 219 2/3 frames with 8.3 K/9 against 1.8 BB/9. Samardzija had previously posted strong peripherals and intriguing ERA estimator tallies, but finally put it all together in his first All-Star campaign.
The 29-year-old was brought to Oakland last summer in a blockbuster that cost the A’s top prospect Addison Russell, and the club currently has significant needs up the middle. In his offseason outlook piece for the A’s, MLBTR’s Steve Adams explained why dealing away Samardzija (or fellow rotation piece Scott Kazmir) could make sense for the club.
Free Agent Faceoff: Max Scherzer vs. Jon Lester
A look at this year’s market for free agent starting pitching reveals a group that is deep in quality options and also features a pair of prime-aged top-of-the-rotation arms in Max Scherzer and Jon Lester. This duo, represented by Scott Boras and ACES, respectively, is commonly believed to be the cream of the free agent crop, but which will be the better buy?
Few pitchers have been as dominant as Scherzer over the past two seasons. In that time, he’s pitched to a 3.02 ERA with 10.2 K/9, 2.5 BB/9 and a 36.5 percent ground-ball rate in 434 2/3 innings. His K/9 rate trails only Yu Darvish among qualified starters, and he grades out well according to ERA estimators FIP (2.79 — sixth) and SIERA (2.94 — eighth). In that two-year stretch, Scherzer leads qualified starters in ERA, FIP, xFIP, SIERA, K/9 and opponent batting average (.216), to name a few categories. He’s entering his age-30 season on the heels of a pair of All-Star appearances and a pair of top five finishes in the Cy Young voting — including his first Cy Young win in 2013. The 6’3″, 220-pound right-hander has cemented himselves among the game’s elite arms and is looking for a sizable payday, as evidenced by his rejection of a six-year, $144MM contract extension in Spring Training.
Lester is no slouch, however, as he ranks second to Scherzer in ERA (3.10) and FIP (3.19) among qualified free agent starters in that time. His SIERA mark, though a ways behind at 3.49, is still third-best over the past two seasons (Brandon McCarthy sits between them). Beyond that, Lester has been more of a workhorse in his career; he has reached the 200-inning mark in six of the past seven seasons, falling shy only in 2011 when he tossed 191 2/3 frames. Lester certainly keeps the ball on the ground more often than Scherzer, with a career ground-ball rate just under 47 percent and sitting at 43.7 percent over the past two seasons. Lester is also coming off the best platform season of any free agent starter, having pitched to a brilliant 2.46 ERA with 9.0 K/9, 2.0 BB/9 and a 42.4 percent ground-ball rate. He’s spent almost all of his career in the hitter-friendly AL East, whereas Scherzer has spent more time in a more favorable pitching environment (Detroit’s Comerica Park). Lester is a year older than Scherzer, however, and he’s thrown about 300 more innings in his big league career. He’s rumored to already have an offer upwards of $120MM from the Red Sox, and another possibly as large as $135MM from the Cubs, so the price tag figures to be substantial here as well.
In our free agent profiles, MLBTR’s Tim Dierkes predicted a seven-year contract for Scherzer while I personally went with six years for Lester, but it certainly wouldn’t be a shock to see a team guarantee Lester that seventh season. The above paragraphs are a mere snapshot of each pitcher, while the linked profiles offer a more in-depth look at the pair of aces. You can read over those to brush up on each pitcher’s strengths and weaknesses before making a vote below if you wish, but let’s get to the question at the root of this post.
Which starting pitcher would you rather sign?
-
Jon Lester 51% (15,356)
-
Max Scherzer 49% (14,562)
Total votes: 29,918
Ronald Belisario Elects Free Agency
Right-hander Ronald Belisario has elected free agency rather than accepting an outright assignment to Triple-A, MLB.com’s Scott Merkin tweeted earlier today.
Belisario, 32 on New Year’s Eve, pitched 66 1/3 innings for the White Sox in 2014, though he struggled to a 5.56 ERA with a below-average mark of 6.4 K/9. However, Belisario also posted a strong 2.4 BB/9 with an outstanding 59.3 percent ground-ball rate, leading metrics such as FIP (3.54) and SIERA (3.22) to feel that he was experienced some particularly poor luck. He did see his BABIP spike to a career-worst .339, and his 57.7 percent strand rate was well below both the league average and his career mark (69.9%).
Belisario has been a fixture in a big league bullpen in each of the past three seasons, averaging 68 innings per year with the White Sox and Dodgers. FIP and xFIP have graded him pretty consistently throughout his career and both feel he’s capable of an ERA in the 3.60 range, while SIERA (3.22) is a bit more bullish.
Marlins Acquire Aaron Crow
The Marlins have acquired right-hander Aaron Crow from the Royals in exchange for left-hander Brian Flynn and minor league righty Reid Redman, the teams announced.
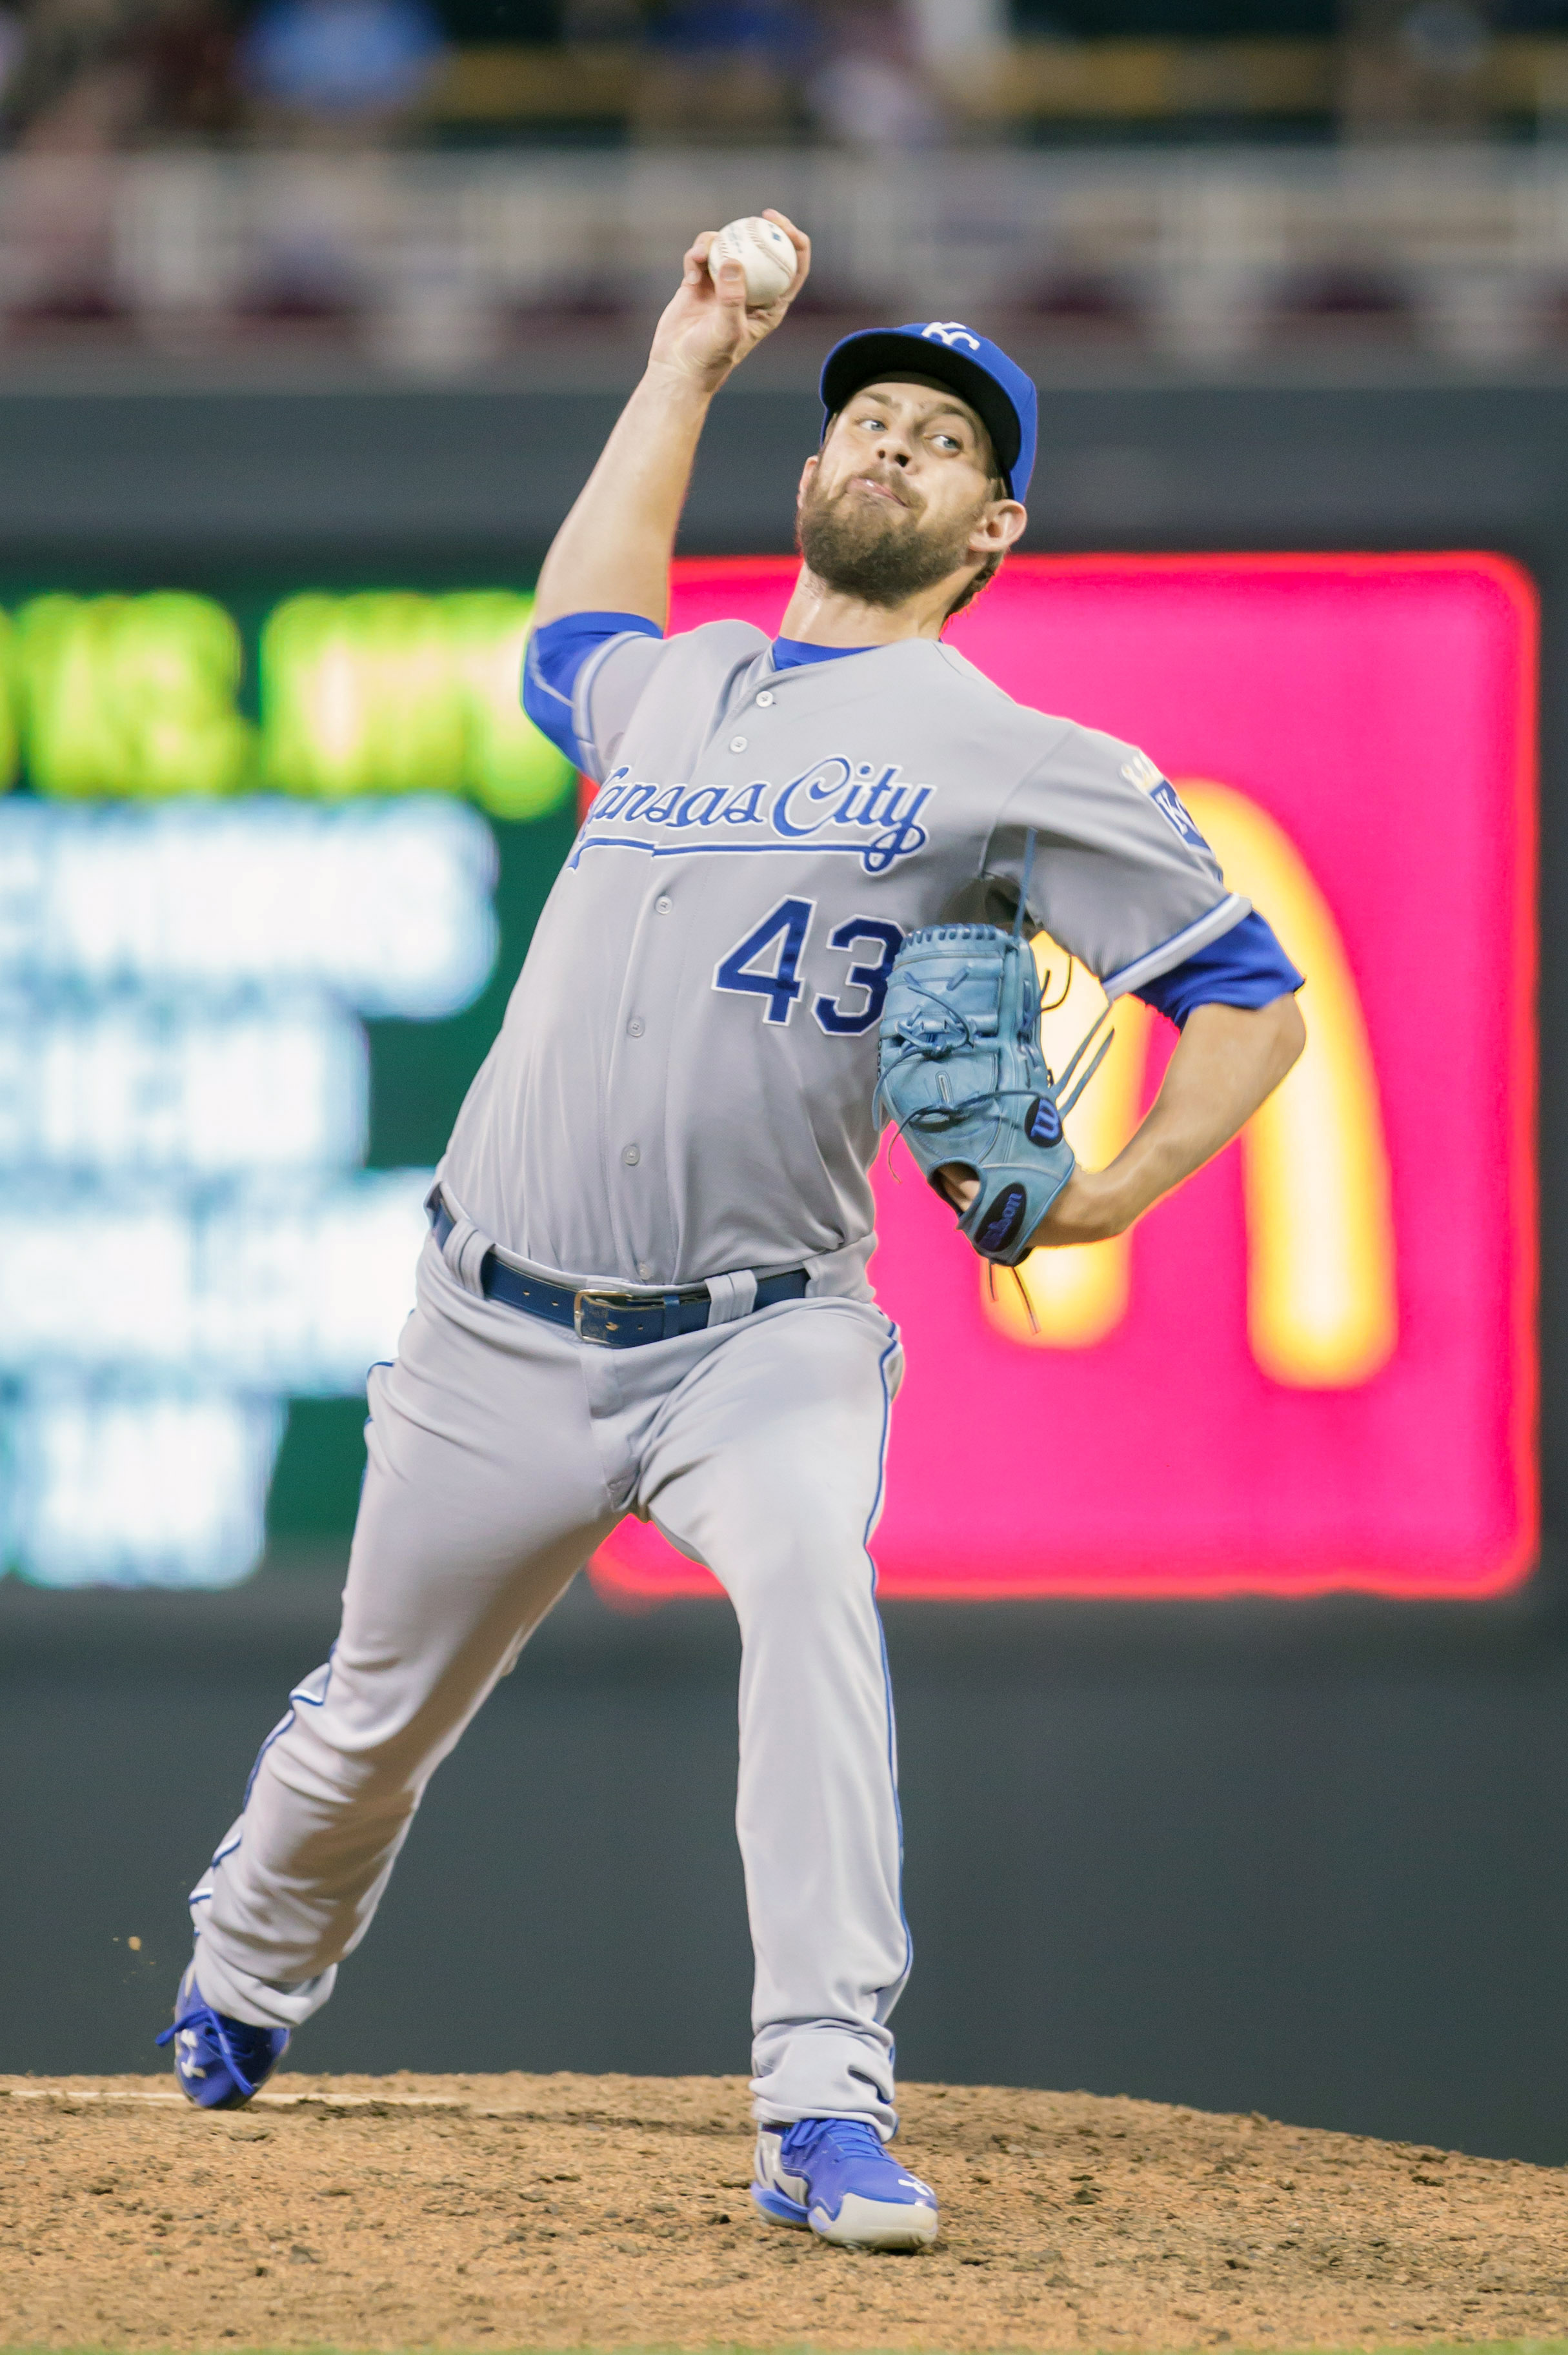
Crow, 28, has considerably more big league experience than the 24-year-old Flynn. Crow has spent the past four seasons as a setup man for manager Ned Yost, pitching with great effectiveness from 2011-13. In his first three years with the Royals, Crow posted a 3.19 ERA, 9.0 K/9, 3.9 BB/9 and a ground-ball rate north of 50 percent.
However, the typically hard-throwing former No. 12 overall pick struggled this year as his velocity dropped. Crow posted a career-worst 4.12 ERA with a career-low 5.2 K/9 rate against 3.7 BB/9 in 59 innings this past season. His ground-ball rate dipped to a career-low 43.2 percent as well. On the plus side, he didn’t miss any time due to injuries, so if the Marlins saw something in Crow’s delivery that they feel can be fixed, they could have a nice bullpen piece on their hands at a relatively modest price. Crow is projected by MLBTR contributor Matt Swartz to earn $2MM in 2015, though his struggles did make him a non-tender candidate. It’s possible that with today’s signing of Jason Frasor, the Royals felt they had found a cheaper solution to their middle relief needs. With exactly four years of service time under his belt, Crow can be controlled by the Marlins for an additional two seasons.
The Marlins originally acquired Flynn from the Tigers along with Jacob Turner and Rob Brantly in the trade that sent Omar Infante and Anibal Sanchez to Detroit. Since being acquired by Miami, Flynn has seen a couple of brief Major League stints, allowing 24 runs in 25 innings with a 21-to-16 K/BB ratio. Those numbers aren’t the most impressive, obviously, but he has a considerably better minor league track record and has been a mainstay on Marlins top prospect lists. Heading into the season, Baseball America ranked him sixth among Fish farmhands, while MLB.com ranked him 10th on their midseason Top 20 list.
Flynn has a lifetime 3.44 ERA with 7.3 K/9 and 2.9 BB/9 in 277 2/3 innings at the Triple-A level. In their scouting report, BA praised a fastball that sat 89 to 93 mph and touched 95 out of the 6’7″ lefty’s hand. Flynn features a four-pitch mix with his best offspeed offering being a slider, per BA, and he also features an average changeup and a show-me curveball that he mixes in less often. Flynn will provide the Royals with another Major League ready rotation option, but he could also fill a need in the bullpen, as the Royals are without a solid lefty relief option.
Redman, who recently turned 26, reached Double-A for the first time this season. Drafted by Tampa in 2012 as a third baseman, Redman has successfully converted to the mound since that time. In 90 professional innings, he has a 2.00 ERA with 9.3 K/9 and 2.1 BB/9.
Ken Rosenthal of FOX Sports reported the swap of Crow and Flynn, and the Marlins then announced that Redman was in the deal (Twitter link).
Photo courtesy of USA Today Sports Images.
Royals Re-Sign Jason Frasor
The Royals announced that they have re-signed right-hander Jason Frasor to a one-year deal with a mutual option for the 2016 season. Frasor, a client of agent Dave Meier, reportedly receives a $1.25MM base in 2015 with a $2MM option that contains a $550K buyout. That makes for a $1.8MM guarantee, and the deal also calls for as much as $500K of incentives in each season.
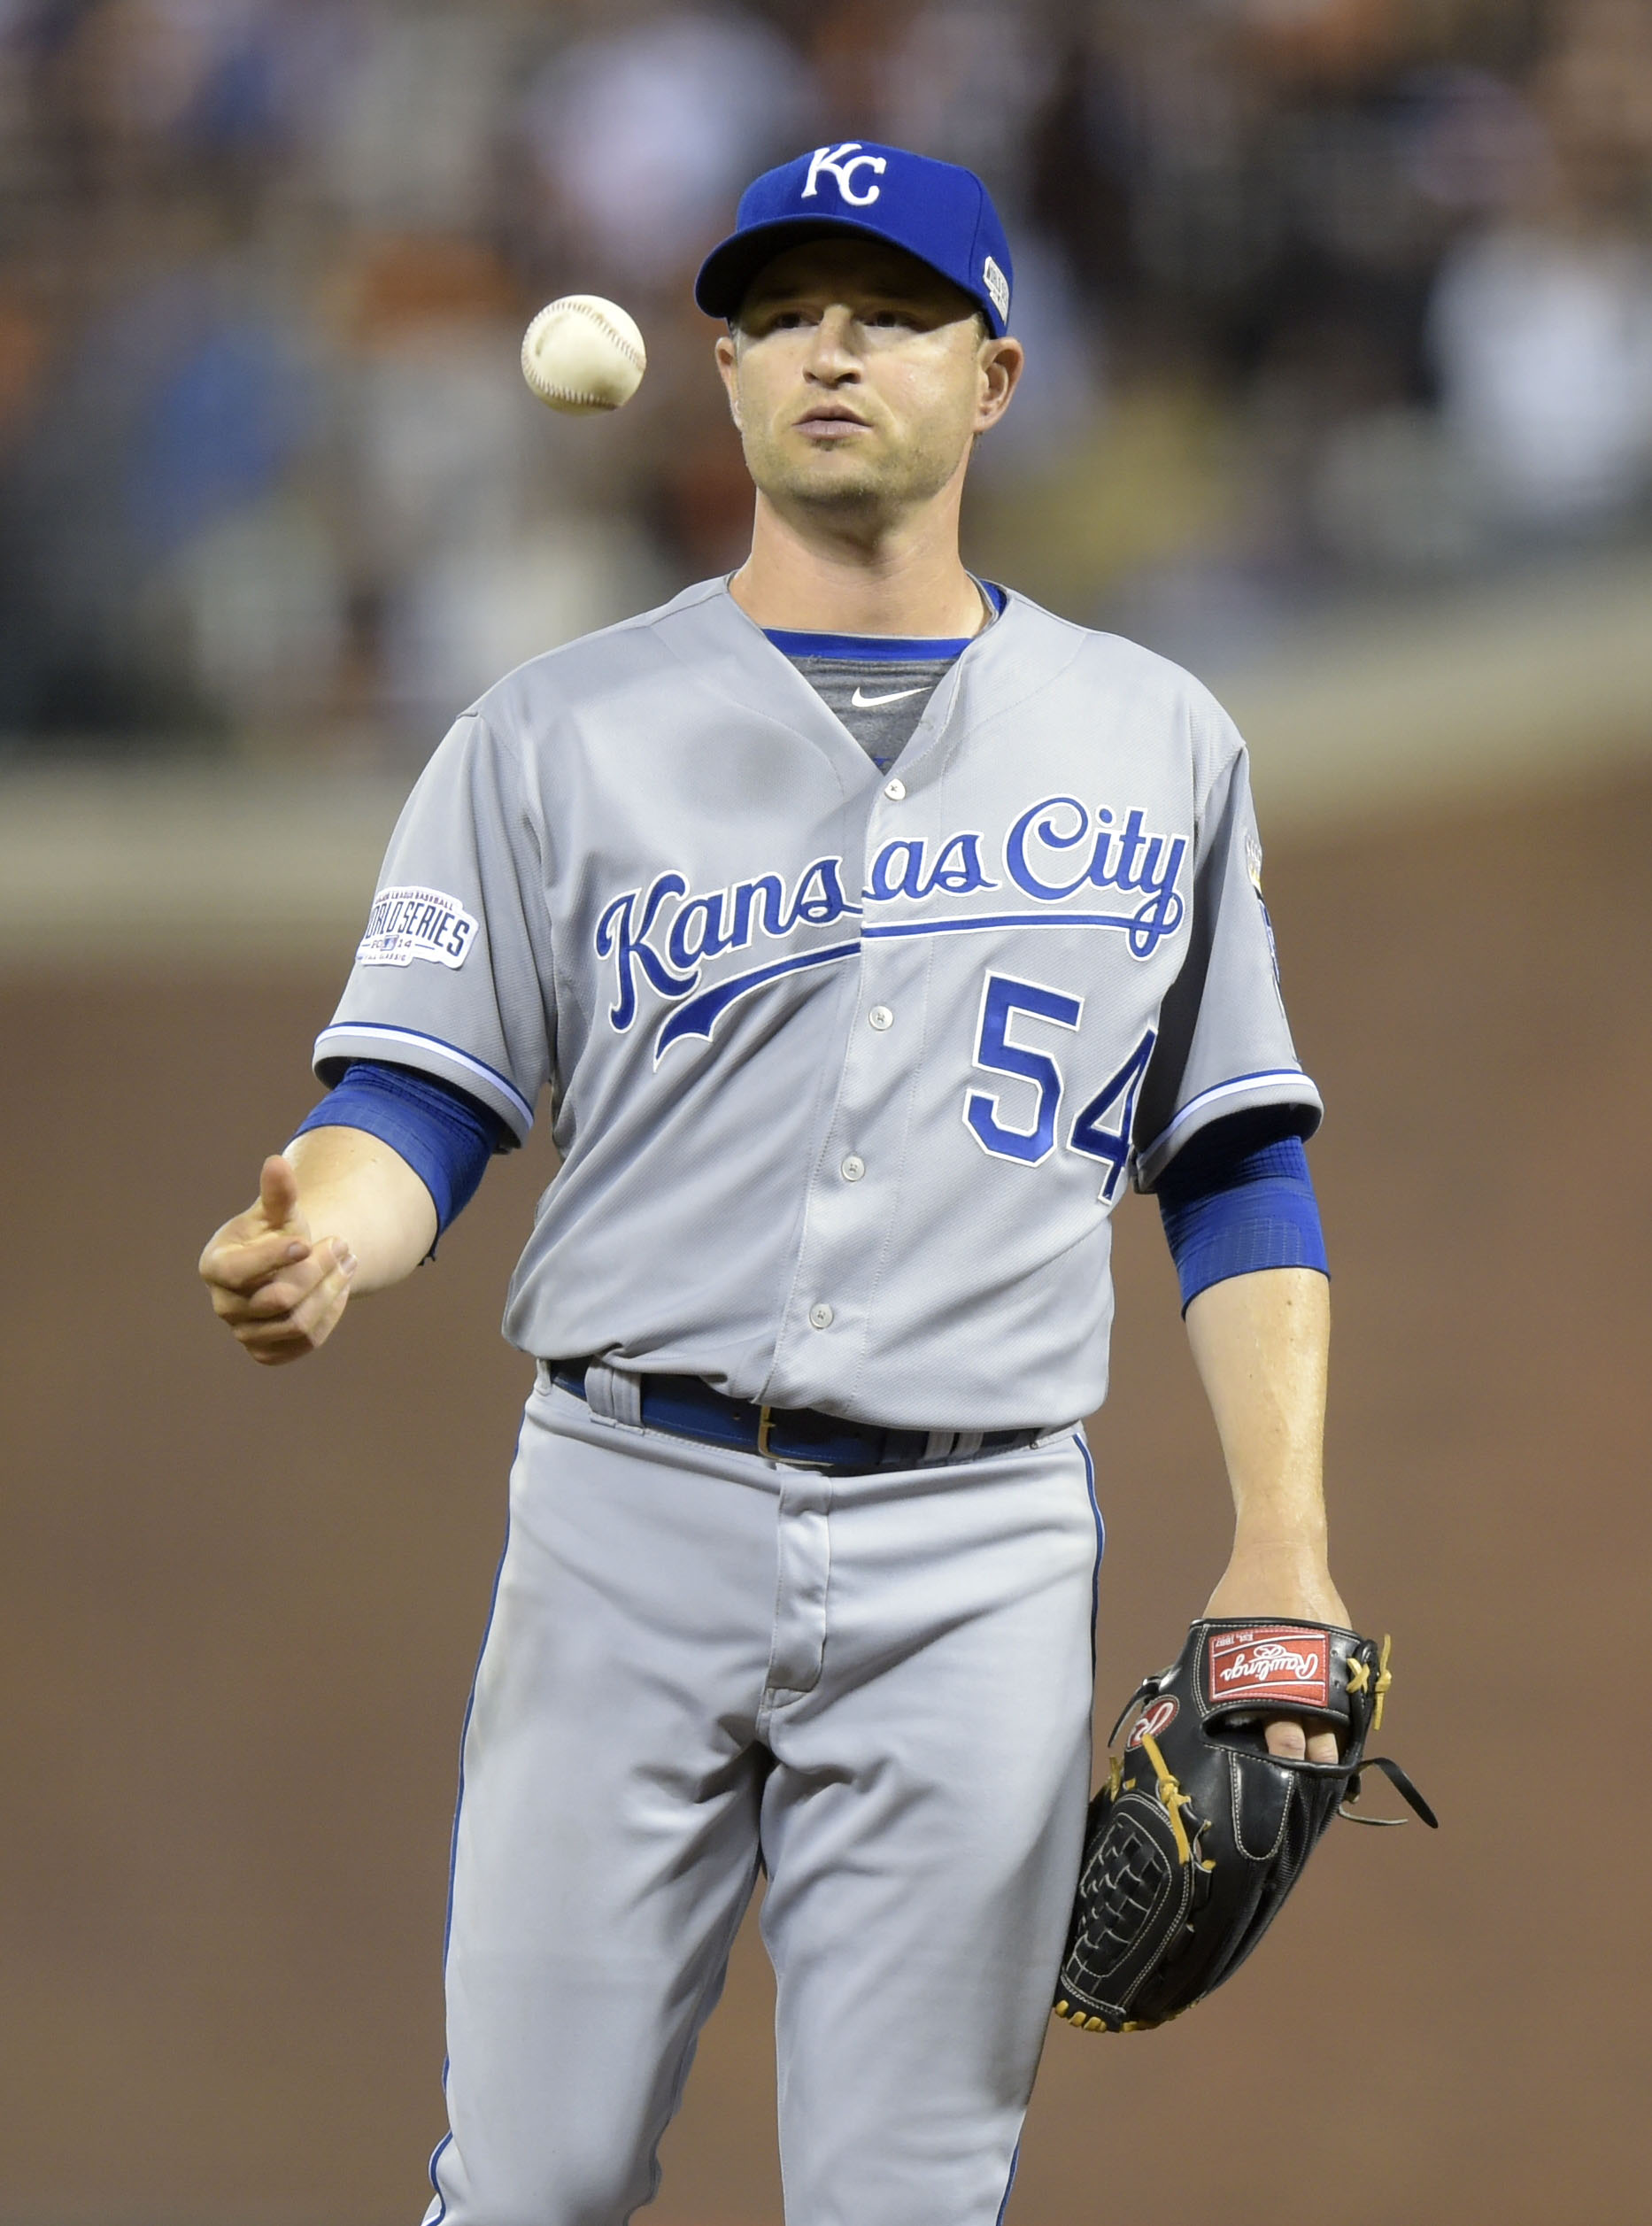
Frasor, 37, was acquired by the Royals in a mid-July swap that sent minor league righty Spencer Patton to the Rangers. The veteran Frasor was excellent for the Royals in both the regular season and the postseason, allowing a combined four earned runs in 23 innings of work. Frasor doesn’t have the 93 mph heat that he used to, but he did average 91.9 mph on his fastball in 2014. Overall, he posted a solid 2.66 ERA with 8.7 K/9, 3.4 BB/9 and a 46.9 percent ground-ball rate in 47 1/3 regular season innings between the Rangers and Royals.
The Royals became notorious for their smothering defense and lights-out bullpen in the playoffs this year, but the relief corps was actually a very top-heavy unit. Behind Greg Holland, Wade Davis and Kelvin Herrera, only Aaron Crow topped 40 innings, and Crow was largely ineffective. Frasor will provide the club with some much-needed depth in the middle innings.
As I noted in Kansas City’s Offseason Outlook, bullpen help was (and likely still remains) an area of need for the Royals. In particular, the club will likely look at left-handed relief options, as they’ll be short on reliable southpaws next season. Tim Collins struggled with his command again in 2014 and is a non-tender candidate (though GM Dayton Moore did previously indicate to McCullough that he’s still considering tendering a contract to both Collins and Crow), and Scott Downs departed via free agency. That Frasor was able to be had on a modest deal is good news for the Royals, who already projected to field a payroll in the mid-$80MM range before this signing. It’s been reported that Kansas City’s payroll could top $100MM next season, so there’s some flexibility, but adding some reliable innings on a relatively low-cost deal addresses one need without significantly denting Moore’s available funds, allowing him to look for further upgrades in the rotation and possibly in right field.
Andy McCullough of the Kansas City Star was the first to report the terms of the contract (Twitter links).
Photo courtesy of USA Today Sports images.
Arbitration Breakdown: Todd Frazier
Over the next few weeks, I will be discussing some of the higher profile upcoming arbitration cases. I will rely partly on my arbitration model developed exclusively for MLB Trade Rumors, but will also break out some interesting comparables and determine where the model might be wrong.
Todd Frazier enters his first year of arbitration this winter coming off a career year. In 660 PA, Frazier hit .273, stole 20 bases, smashed 29 home runs and collected 80 RBIs. The Reds’ third baseman has some solid pre-platform year numbers as well, having already accumulated 44 home runs and 155 RBIs before 2014, as well as 10 steals and a .249 average in 1186 PA. Several players have entered arbitration with similar numbers in recent years, but Frazier has somewhat of a leg up on many of them. As a result, my arbitration model projects him to get $4.6MM this winter. While I think that is more likely to be high than low, I do not think he is likely to miss this mark by much.
One promising comparable for Frazier could be Jason Heyward in 2013. He earned $3.65MM after 650 PA with 27 home runs and 21 stolen bases, along with 82 RBI and a .269 average. Basically, his platform season is a dead ringer for Frazier’s but Frazier’s pre-platform power numbers are better, as Heyward hit 32 homers (12 less than Frazier) and 114 RBIs (41 less than Frazier). Both had similar averages in their pre-platform years (Heyward hit .255), and Heyward stole 20 bases to Frazier’s ten. Frazier also had amassed 1186 pre-platform PA, to Heyward’s 1077. Since Heyward is so similar to Frazier in his platform year, yet Frazier clearly has him beat in his pre-platform years, it seems likely that Frazier will beat Heyward’s $3.65MM mark. The fact that salaries have grown over the last couple years also factors into Frazier’s higher projected salary.
CAA Sports, Frazier’s agency, could try to argue for Dan Uggla on the high side. Uggla earned $5.35MM in his first year of arbitration, although that was six years ago and thus less likely to be used as a comparable. Furthermore, Uggla was a second baseman, and Frazier is more apt to be compared to outfielders or other corner infielders. This being said, Uggla’s case is somewhat similar — he had 32 home runs and 92 RBI in 2008, so his power numbers bested Frazier’s 29 and 80 in his platform year, and he also had better numbers in his pre-platform years (58 HR and 178 RBI) than Frazier (44 HR and 155 RBI). Frazier had a slightly better platform-year average (.273 versus .260) though his .249 average over his pre-platform years was lower than Uggla’s .263 mark. Overall, Uggla’s $5.35MM number seems like the absolute ceiling of what Frazier can expect to earn.
A couple other players between Heyward’s $3.65MM and Uggla’s $5.35MM are possible comparables for Frazier as well. Pedro Alvarez agreed to a $4.25MM deal last year after having better power numbers, but a lower average and fewer steals than Frazier both in his platform and pre-platform years. Alvarez had 36 HR and 100 RBI in his platform year and 50 HR and 168 RBI in his pre-platform years. Alvarez’s averages, however, in his platform (.233) and pre-platform years (.237) fall short of Frazier’s .273 and .249, and he only had two steals both in his platform and pre-platform years, falling well short of Frazier’s 20 and 10 steals in each respective period. Overall, depending on how power gets treated relative to average and steals, Alvarez could be seen as a superior or inferior case to Frazier.
Another possibility is comparing Frazier to Mark Trumbo, who earned $4.8MM last season. Trumbo had a .234 average, but 34 HR and 100 RBI with five stolen bases in his platform year, and he hit .259 with 61 home runs and 184 RBIs with 13 stolen bases in his pre-platform years. Trumbo has better numbers across the board in his pre-platform years, but his platform year again asks the question of whether power or batting average and stolen bases are more important. Given all the factors that could eliminate Uggla — 2B vs. 3B, 2008 vs. 2014, etc. — from being a comparable to Frazier, Trumbo’s $4.8MM will in all likelihood be seen as the true ceiling for what Frazier can earn in arbitration.
My best guess is that Alvarez is seen as the most appropriate comparable for Frazier. Alvarez has something of the edge in power numbers while Frazier has the edge in the batting average/stolen base numbers, though there isn’t really a huge gap in any of the categories. Frazier could potentially earn a slight increase representing inflation over Alvarez if they are seen as similar, however. While the model projection of $4.6 is probably too high, I think the Reds third baseman will get relatively close to that number.
At Least Four Teams Interested In Yoan Lopez
Cuban right-hander Yoan Lopez has drawn “strong interest” from several teams, including the Diamondbacks, Giants, Padres and Yankees, MLB.com’s Jesse Sanchez reports. The 21-year-old Lopez held one showcase for scouts earlier this month and will showcase himself again next week in the Dominican Republic.
Lopez is a 6’4″, 190-pound pitcher who has three seasons under his belt for Isla de la Juventud of Cuba’s Serie Nacional. Major League Baseball has declared Lopez a free agent, but the righty still has to receive clearance from the U.S. Department of the Treasury before he can sign with a team.
According to Sanchez, Lopez “throws a cut-fastball, a change, a curve and a slider, but is best known for a fastball that hovers in the 93-to-95 MPH range. His fastball has been clocked at 100 MPH three times since he began working out for teams.”
The Yankees are one of four clubs (the others being the Rays, Red Sox and Angels) who have already exceeded their spending pools for the 2014-15 international signing period, as Sanchez notes. This could make these teams more apt to spend on Lopez since they’re already being penalized anyway, though if Lopez doesn’t receive his clearance by June 15, the quartet will be prohibited from spending more than $300K to sign Lopez or any pool-eligible player for each of the next two international signing periods. If one of the other 26 teams particularly fancies Lopez, of course, they can always exceed their pool limit and accept a penalty themselves.
The D’Backs made a big splash in the international market yesterday by signing Cuban outfielder Yasmany Tomas, while the Padres and Giants were finalists for Tomas’ services. San Francisco and New York were recently listed by Baseball America’s Ben Badler as two of the top contenders for another star Cuban prospect, Yoan Moncada. The Yankees, of course, were by far the most active team of the 2014-15 signing period, making deals with ten of Baseball America’s top 30 international prospects.
Scherzer, Lester, Shields And Career Pitch Counts
Agent Scott Boras has the prize of free agency in Max Scherzer, and Boras has taken to touting his client’s “pitching odometer.” Boras explained to Jon Heyman of CBS Sports, “[Scherzer] really has the [arm] of a 25 or 26 year old. This is like signing a 25 or 26-year-old pitcher.”
Perhaps reflecting what is found in Scherzer’s binder, Heyman cited the following stats:
“Did you know Scherzer, 30, has thrown 20,954 pitches, to 26,321 for Jon Lester and 29,461 for James Shields, the other top two free-agent pitchers in a top-heavy market containing three aces?”
Scherzer has thrown 8,507 fewer pitches than Shields and 5,367 fewer than Jon Lester. This difference may seem relevant, but in the end it will not matter. Instead, the focus should be on the trio’s birth date.
Context For Number Of Pitches Thrown
When looking at the total number of pitches, the zeros get in the way. For each game started, an ace will throw about 100 pitches. Most aces will start 30+ times a season, so each healthy ace-level pitcher can expect to throw at least 3,000 pitches in a season. The number could grow even higher with longer starts, more regular season starts and postseason games. Just using 3,000 pitches for a season and looking at each pitcher’s age, Boras’ difference can be explained by prorating the pitches thrown back to their age-29 season (Scherzer’s age at the end of last season).
Pitches prorated back to age-29 season
Scherzer: 20,954
Lester: 23,321
Shields: 17,461
The number of pitches thrown really just comes down to age. Scherzer’s arm had less mileage on it than Lester’s arm at the same age, but more than Shields. The difference of 8,500 pitches may seem like a ton, but for pitchers four years apart in age, the number is completely reasonable.
Pitches Thrown And Likelihood Of Next-Season DL Stint
Now, is there a magic number of pitches when a pitcher’s arm just quits being healthy? Is 25,000 pitches the point? 30,000? My study finds that no magic number exists. Actually, the opposite is true.
I looked at the career pitches thrown by pitchers from 2001 to 2012, then put the pitchers into 3,000-pitch groups and to find their chances of a DL stint next season. Here are the DL percentages for pitchers as they put more mileage on their arms. (Note: 39% of all established pitchers will go on the DL at some point the next season. (n) refers to the number of pitcher-seasons in the sample.)
# of pitches (n): DL rate, average # of DL days per pitcher
6000-8999 (674): 36%, 24
9000-11999 (470): 39%, 26
12000-14999 (324): 40%, 29
15000-17999 (225): 45%, 33
18000-20999 (179): 37%, 29
21000-23999 (111): 42%, 26
24000-26999 (99): 39%, 24
27000-29999 (88): 39%, 27
30000-32999 (71): 45%, 38
33000-35999 (47): 34%, 27
36000-38999 (28): 50%, 21
39000-41999 (26): 38%, 27
> 42000(79): 37%, 23
There are some increases and decreases, but generally the DL rate hovers around the expected 39%.
Here are the numbers grouped into 9,000-pitch blocks.
# of pitches (n): DL rate, average # of DL days per pitcher
6000-14999 (1468): 38%, 26
15000-23999 (515): 42%, 30
24000-32999 (258): 41%, 29
33000-41999 (101): 40%, 25
>42000 (79): 37%, 23
It may not seem intuitive that pitchers will have a smaller DL chance as they throw more, but they do. At 24,000 pitches, a pitcher has been productive and healthy enough to be in the league around eight seasons. Besides just the number of DL stints, the time spent on the disabled list is just as important. The pitchers could go on the DL and stay there because of a major injury. If high-pitch pitchers were staying on the DL longer, the average number of days would be seen going up. Instead, they decline.
Pitches Thrown And Expected Future Innings Pitched
The three pitchers in question — Scherzer, Lester, and Shields — are each looking for a multi-year deal. How many innings can teams expect out of these pitchers in the future? Looking at the pitches a pitcher has thrown in his MLB career from 2001 to 2009, here are the innings thrown in the next five seasons.
Pitches (n): IP
6000-8999: (468): 302
9000-11999: (364): 324
12000-14999: (249): 354
15000-17999: (176): 398
18000-20999: (129): 426
21000-23999 (86): 427
24000-26999 (81): 446
27000-29999 (68): 372
30000-32999 (45): 430
33000-35999 (32): 381
36000-38999 (17): 557
39000-41999 (18): 508
> 42000 (68): 476
And now the same data grouped into a few large groups.
Pitches (n): IP
6000-14999 (1081): 322
14000-23999 (391): 414
24000-32999 (194): 416
33000-41999 (67): 460
> 42000 (68): 750
Just because a pitcher has a ton of mileage on his arm doesn’t mean he is about to break down. He could continue to throw for years to come. The more pitches a pitcher has thrown, the better the chances he continues to throw. The three pitchers in question have passed the threshold of being healthy and good.
2015 DL Chances For Scherzer, Lester, Shields
Every pitcher (including these three) will eventually break down, we just don’t know when. An injury risk can be assigned to every pitcher. I have used a DL chance formula to determine the chance a pitcher will end up on the DL with accurate results. Using the formula, here their DL chances for 2015.
Name: Scherzer, Lester, Shields
Age: 29, 30, 33
GS (’12 to ’14): 98, 98, 101
DL Stints (’12 to ’14): 0, 0, 0
DL Chance: 34%, 35%, 38%
These three pitchers each have health (no recent DL stints) and a history of being able to make about 33 starts per season on their side. The only difference among them is age, which makes Scherzer the least likely to end up on the DL.
Boras continues to mention Scherzer’s pitching odometer as an advantage over Lester and Shields. However, the number of pitches thrown is not indicative of future injury. A high number shows the pitcher can hold up to the grind of being able to successfully throw for full seasons. The main issue between the three pitchers is age. Scherzer is four years younger than Shields. Scherzer’s body may still be able to hold up a bit better than the other pair, but they are still some of the healthiest pitchers in the league. The debate about the trio’s durability should begin and end with age.
Free Agent Profile: Torii Hunter
At 39 years of age, Torii Hunter is no longer the player he once was. But his reliable bat and clubhouse presence are sure to lead to plenty of interest.
Pros/Strengths
As he has throughout his career, Hunter hit in 2014. His 111 OPS+ (.286/.319/.446) marked the ninth consecutive season in which he has been at least 10% above league average in overall batting production (per that metric). Since becoming a regular in 2001, Hunter has only once (barely) dropped below the mean.

Neither is there any particular reason to think that a cliff is nearing. Hunter’s walk rate has been down sharply in the last two seasons — around 4% after posting numbers that were as much as twice that rate in the not-so-distant past — but he has also driven down his strikeout rate to a career-low 15.2%. And the contact is still good: Hunter posted a personal second-best 21.3% line drive rate last year and put the ball on the ground right at his career average. Bat speed and reflexes do not appear to be a problem; pitchers threw Hunter fastballs 57.6% of the time last year, the lowest percentage of his career.
That remarkable consistency is equaled by Hunter’s durability. Since the start of the 2007 campaign, Hunter has seen just one DL stint (for five weeks owing to a groin strain back in 2009). He has had his share of rest in recent years, averaging 142 games played over the last three seasons, but has made at least 584 trips to the plate in each of those.
It might reasonably be expected that teams will look beyond the numbers in determining their interest level in Hunter. He has 18 MLB seasons under his belt, and is widely characterized as a desirable clubhouse leader.
Cons/Negatives
Defensively, Hunter had already regressed from a solid center fielder to a solid right fielder. But over the last two years, defensive metrics have soured considerably on his work in right. Defensive Runs Saved, which judged Hunter a +15 contributor in 2012, has moving to -10 and then -18 since. Ultimate Zone Rating noted a less pronounced fade in 2013, but concurred with DRS on Hunter’s overall value last year. The issue, per UZR’s assessment, is clear: while Hunter’s arm and error propensity are approximately average, his range has disappeared.
At the plate, one could quibble and note that Hunter’s output last year was at the bottom range of his career range. While it would be a stretch to say that portends a precipitous decline – after all, he was still produced within the bounds of his career norms and did so on a career-average BABIP – that fact does, perhaps, dampen the notion that he might return to his 2012 levels (.313/.365/.451, albeit on a .389 BABIP).
Likewise, Hunter’s counting stats are down from his peak. He is no longer a threat to steal twenty bags or to hit 25-30 home runs. On the other hand, the loss of speed is not surprising, and Hunter still grades out well on the bases. And as for power, Hunter’s decline has tracked a more general league trend, and he still put up a .160+ ISO over each of the last two years and has never hit less than 16 long balls in a full season.
Personal
Hunter was born and raised in Arkansas, going straight from Pine Bluff to the Minnesota Twins after he was chosen in the first round of the 1993 draft. He is one of only two players from the first round of that draft still active in the majors, the other being first overall pick Alex Rodriguez.
Hunter makes his offseason home in the Dallas-Forth Worth area with his wife, Katrina. As he told MLB.com’s Jason Beck, the Hunters are already empty-nesters. Several of his sons excel at sports as well, enrolling in colleges on football scholarships, and Hunter says that he enjoys traveling to watch them in action.
Market
While the Tigers are not interested in a reunion at this point, recent reports suggest that as many as ten teams have already shown interest in the Reynolds Sports Management client, including the Royals, Cubs, Giants, Rangers, Blue Jays, and Mariners.
Then, of course, there are the Twins, Hunter’s former club. The veteran says he has had several conversations with Minnesota GM Terry Ryan. He has also indicated that he wants a regular role on a legitimate contender, and it would be difficult to cast the Twins in that light. Either way, having already earned over $160MM during his outstanding career, he seems unlikely to view the highest bid as a trump to personal preference.
The corner outfield market contains several players in the same general market niche as Hunter, though each obviously has their benefits and drawbacks. With Michael Cuddyer going to the Mets, teams looking for veteran production down the lines can also look to Alex Rios and Michael Morse.
It bears noting that Hunter has almost exclusively played right field since he moved off of center. He has spent a mere 119 1/3 frames patrolling left, all before he became a fixture in the Twins’ lineup. With his range being the major question, and his arm still playing at the big league level, it seems likely that he will be targeted primarily by clubs having (or willing to make) an opening on that side. As the list of teams with apparent interest would indicate, Hunter’s most obvious fit is with an American League club that plans to utilize some manner of platoon situation for its designated hitter slot, as he could benefit from a reduced defensive load as he enters his age-39 season.
Expected Contract
Hunter should have several appealing situations to ponder. To some extent, of course, the breadth of interest relates to the fact that he figures to be available on a short-term deal at a palatable rate. For teams looking to lock in a decent level of production at the plate for the short term, while keeping future payroll flexibility, Hunter makes for a highly appealing option.
Multiple years are certainly within reach if Hunter is interested, though he may not be – and may see somewhat reduced interest and lower-AAV offers if he does pursue that route. Cuddyer’s two-year, $21MM deal sets the market at the corner, and carries an even higher implied valuation since it required the Mets to sacrifice the 15th overall pick in the upcoming draft. (Applying a 3x multiplier to the slot value of that pick last year results in a rough $7.5MM valuation of New York’s added cost. As discussed by Jeff Sullivan of Fangraphs, however, other means of estimation might put the value in the $10MM to $15MM range.)
Ultimately, assuming Hunter picks amongst the clubs pushing the top of his market, I think he will land a deal in the range of two years and $22MM. If he ultimately falls shy of that mark, it could well be because he prefers a one-year deal or takes a discount for one reason or another.
Arbitration Breakdown: Greg Holland, Aroldis Chapman, Kenley Jansen, Steve Cishek
Over the next few weeks, I will be discussing some of the higher profile upcoming arbitration cases. I will rely partly on my arbitration model developed exclusively for MLB Trade Rumors, but will also break out some interesting comparables and determine where the model might be wrong.
Four relievers enter their second year of arbitration eligibility this winter, with a chance to collectively make a huge impact on that market. Each will influence each other’s salary as they did last year, and will influence many players that follow in the coming years. Greg Holland, Aroldis Chapman, Kenley Jansen, and Steve Cishek each became full-time closers during their second full seasons in 2012, and have dominated hitters since.
Becoming a closer so early was a rare feat just a few years ago. Teams used to give three-year or four-year deals worth upwards of $10 million per year for an “established” closer. Players like Francisco Cordero, Joe Nathan, Mariano Rivera, Brad Lidge, Francisco Rodriguez, Rafael Soriano, and Jonathan Papelbon signed such deals that began between 2008 and 2012, and few of those worked out. As I wrote several years ago, teams were paying far more per WAR for relievers than any other position on the diamond by far. Obviously the measurement of WAR is tricky, but regardless of how it is measured, it was clear that allocating $10 million to a guy to throw 60 innings three years down the line was not working out for many teams.
Fortunately, something happened that gave a number of teams the opportunity to change their ways. An onslaught of talented young pitchers emerged onto the scene with incredible fastballs, and many were given the opportunity to be closers quickly. Craig Kimbrel is actually from the same service class as these four players but he signed a four-year deal last winter. However, that makes five teams who quickly established a young arm in the closing position and had some success with it. Of course, now that these guys have some experience, the price has gone up.
Holland had the best year of the foursome, with a 1.44 ERA and 46 saves. Jansen was no slouch with a 2.12 ERA and 44 saves, Chapman’s ERA was just 2.00 and he had 36 saves, while Cishek had 39 saves but a more pedestrian 3.17 ERA. As a result, the model predicted a $4.62MM raise for Holland, $3.5MM for Jansen, $3.1MM for Cishek, and $3.05MM for Chapman. The model weighs heavily on saves since the market for relievers has done so in recent years, so it has unsurprisingly ranked their raises by saves. Holland’s raise is actually subject to “The Kimbrel Rule,” which states that a player cannot beat the record for his role and service time by more than $1MM, so his projected raise is limited to $4.275MM (topping Francisco Rodriguez’s $3.275MM raise from 2007 by $1MM), which gives him a $8.95MM projected salary.
What makes these guys even more unique is the fact that so few teams have gone year-to-year in arbitration with their closers. Jason Motte, Jonathan Broxton, and Carlos Marmol have each gotten two-year or three-year deals in recent years. Obviously Kimbrel’s four-year deal meets those criteria as well.
In fact, the only closer with 30 saves in his platform season, 45 saves in his pre-platform seasons, and an ERA under 3.50 in the last five years who did get a one-year deal during his second year of arbitration was Jonathan Papelbon. He got a $3.1MM raise from the Red Sox in 2010 after putting together 38 saves and a 1.85 ERA. Before him, Francisco Rodriguez’s 2007 raise of $3.275MM is a possible clue (1.73 ERA and 47 saves), as could be Jose Valverde’s $2.7MM raise in 2008 (2.66 ERA, 47 saves), or Chad Cordero’s $2.05MM raise in 2008 (3.36 ERA, 37 saves). However, those last three cases are very old and are less likely to be considered in an arbitration case.
All four of the closers in question will basically have Jonathan Papelbon’s $3.1MM raise and whatever each other get as a reference. I think that there is a strong possibility that Chapman and Cishek do get right around their projected numbers, which are within $50K of Papelbon’s raise. I could see Chapman’s reputation pushing him a little higher, though. And I’m also inclined to agree with the model that Kenley Jansen and Greg Holland, with similar ERA’s and more saves than Papelbon, plus a few years of salary inflation behind their cases, are likely to top Papelbon’s raise. Jansen’s $3.5MM raise seems about right, and while I think the model’s estimate for Holland of a $4.62MM raise strikes me as unlikely, a Kimbrel rule-adjusted $4.275MM raise sounds reasonable.
If I had to guess, I think that these four guys will follow the model well. However, I think that they will either all collectively make the model look good, or the first guy will make it look bad, and the following three guys to sign will make it look worse as they affect each other’s cases. Without many historical comparables that look anything like this foursome, they will all become comparables for each other. Unless their teams follow the Braves and ink a multi-year deal, I would not be surprised if these four guys affect each other’s 2016 salaries as well.