
Looking For A Match In A Carlos Santana Trade
Earlier this week, Ken Rosenthal of The Athletic reported via a rival executive that the Phillies are “shopping the hell” out of first baseman Carlos Santana. The Rhys Hoskins left field experiment went poorly this year, so it’s logical for GM Matt Klentak to attempt to trade the veteran Santana to allow Hoskins to move back to first base in 2019.
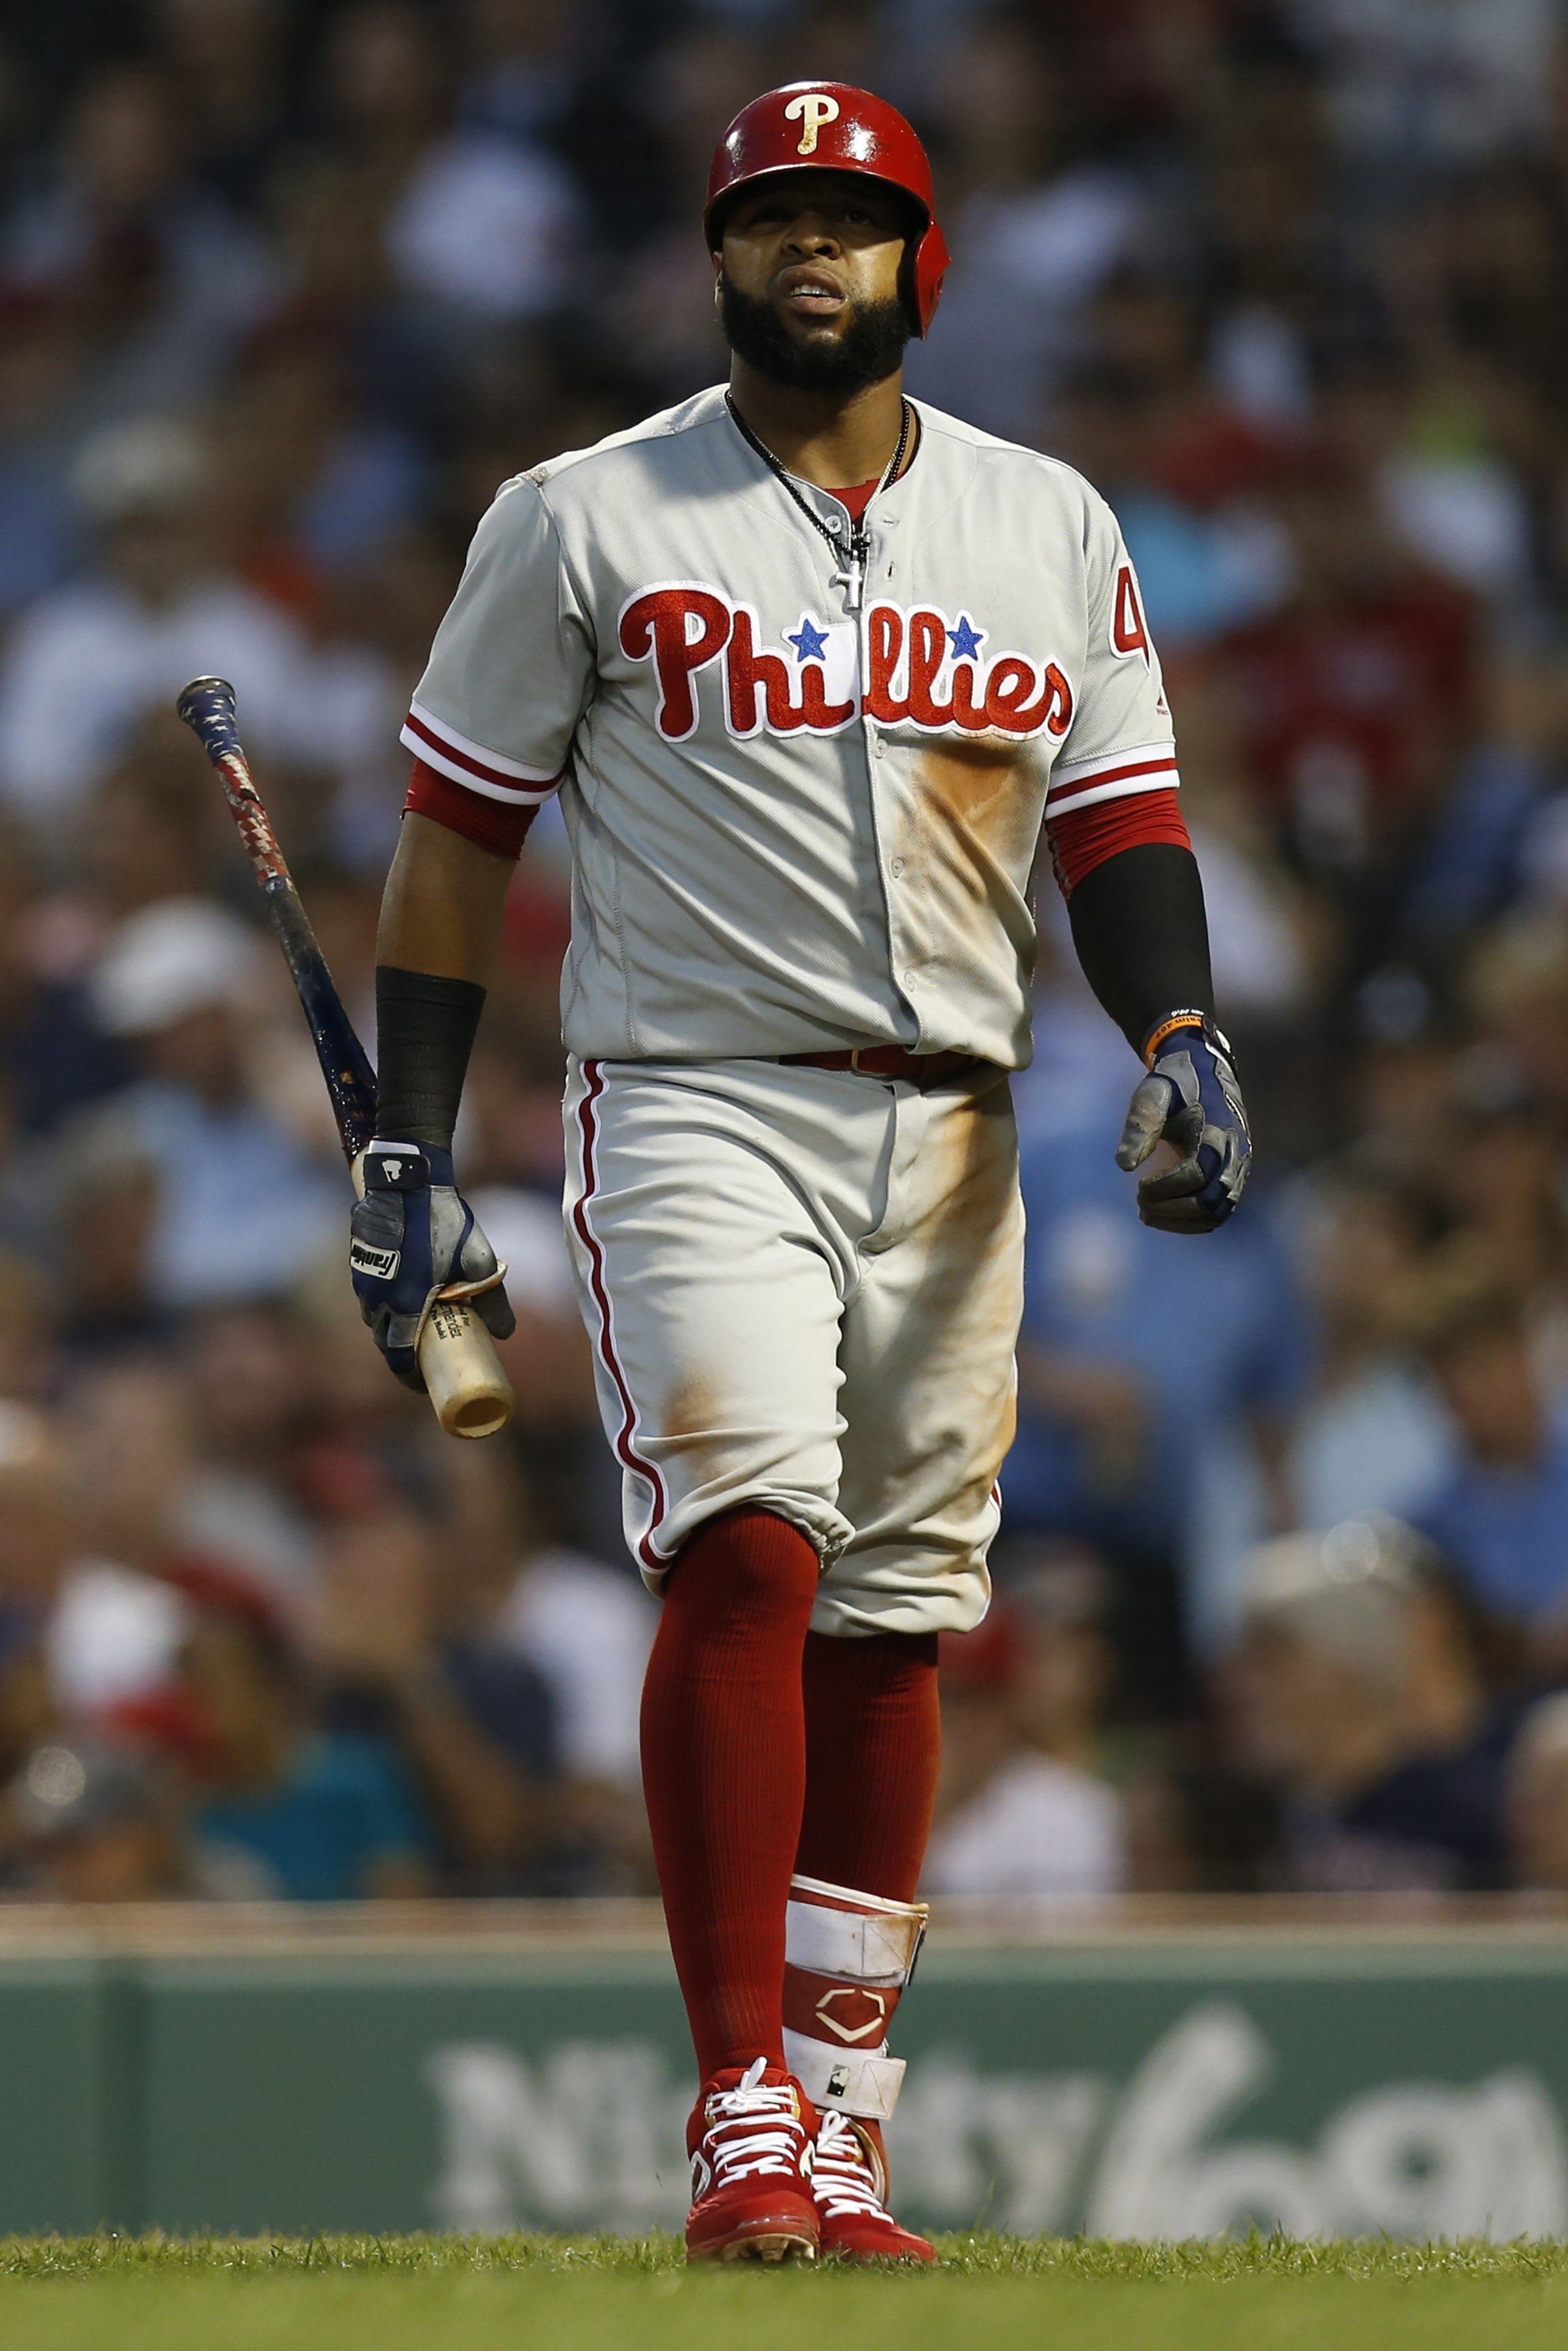
First, let’s take a look at what Santana is in this stage of his career. He’s a switch-hitting walk machine with modest power. He put up a 109 wRC+ for the Phillies this year, and 119 from May onward. Steamer projects a 119 mark on the whole for Santana next year. That’s a level he’s reached only once in the last four seasons, so it would be fair to question such optimism.
Though it’s an unscientific and more conservative guess, I’d expect 110-115. Certainly if you’re a rival GM and Santana is being shopped to you, you’d take my position on his expected offense. Santana has spent most of his time as a first baseman in recent years with the Phillies and Indians, and of course he’s an option at designated hitter as well.
Santana’s contract is a major factor in any potential trade. He’s owed $35MM over the next two years. Given Santana’s strong projection for next year, a case can be made that the Phillies shouldn’t need to pay his contract down significantly. However, I think in reality there are enough cheaper alternatives on the market that the Phillies will have to kick in at least $10MM, or else take back a contract or attach a prospect.
For a look at the other first basemen available this winter, check out Jeff Todd’s market snapshot from last month. The free agent market doesn’t offer any first baseman who qualifies as a definite regular, but the trade market could be robust. Paul Goldschmidt is obviously superior to Santana, while Justin Smoak is a fairly similar hitter who is earning only $8MM in 2019. Though better suited at DH, the Cardinals’ Jose Martinez is also in Santana’s class as a hitter. Martinez has yet to reach arbitration and can be controlled for four more years. I’m not convinced Jose Abreu and Brandon Belt will be on the move this winter. The trade market at first base could also feature a variety of more flawed options, such as Justin Bour (now on waivers), Eric Thames, or Wil Myers. The bottom line: the presence of Goldschmidt, Smoak, and perhaps Martinez could clog Santana’s market, as Goldy is an impact hitter and the others have more desirable contract situations.
There’s also the idea that a team with an established first baseman could acquire Santana to serve primarily as its designated hitter. The DH trade market could include Kendrys Morales, Mark Trumbo, Shin-Soo Choo, C.J. Cron, Matt Davidson, and Miguel Cabrera. As a hitter, only Cabrera is on Santana’s level, and he’s basically immovable due to his hefty contract. The free agent market does offer one option that is superior to Santana as a DH: Nelson Cruz. Cruz projects at a 132 wRC+ next year, and we expect him to sign for less than the $35MM owed to Santana. So if you’re looking to fill a DH spot, you would talk to Cruz’s agent before you’d worry about trading for Santana – unless the Phillies offer to pay down Santana’s contract significantly. You might also look at a player like Daniel Murphy, who carries a similar projection to Santana and should sign for less than $30MM.
If the Phillies are viewing Santana as mainly a contract dump, they might need to kick in $15MM to get him down to the equivalent of a two year, $20MM deal. If the commitment was reduced that far, Santana might start to rise up on teams’ lists above someone like Murphy. Here’s a look at the teams that could be a match for Santana this winter:
- Twins: With Joe Mauer retiring and Logan Morrison reaching free agency, the Twins have an opening at first base and the need for a bat like Santana. They also have room in the payroll for most of his contract. It’s a reasonable match.
- Astros: The Astros make a lot of sense for Santana. He’s a better hitter than their incumbent first baseman, Yuli Gurriel, and they’re open at DH with Evan Gattis reaching free agency. Still, it would be easier for the Astros or Twins to just sign Cruz, so the Phillies would have to make it worth their while.
- Rays: Earlier this month, Marc Topkin of the Tampa Bay Times wrote that the Rays “seek more of a feared overall hitter” than the arbitration eligible C.J. Cron. The Rays also have more payroll space than they’ve had in recent years, making Santana a pretty good fit. The Rays also have Jake Bauers at first base. 27-year-old Ji-Man Choi pitched in at DH this year and should have a job against right-handed pitching. The Rays are a sleeper pick for Santana, though like the Astros and Twins they’d need to be convinced he’s a better option than Cruz.
- Rockies: After giving the bulk of first base time to Ian Desmond this year and getting replacement level production, the Rockies could seek an upgrade. GM Jeff Bridich spoke earlier this month of being “a little bit more focused on our offense this offseason as compared to last season,” and Santana could give a boost compared to Desmond or Ryan McMahon. However, the team’s payroll appears fairly tight and they may also address deficiencies at catcher and in a corner outfield spot.
- Cardinals: The Cardinals deployed the aforementioned Jose Martinez as well as Matt Carpenter at first base this year. Carpenter could move to third base to accommodate a first base acquisition like Santana. However, replacing Martinez with Santana would upgrade the defense more than anything, since they are hitters of similar ability. I could see the Cards taking a look at Santana, but not as their first choice.
- White Sox: The Sox appear likely to stick with Jose Abreu at first base, and could run out a Daniel Palka-Matt Davidson DH platoon. Palka is an option at an outfield corner, so the White Sox could feasibly add Santana as a primary DH who also chips in at first base. They’ve got plenty of payroll space as well.
- Angels: The presence of both Shohei Ohtani and Albert Pujols make the Angels an unlikely match for Santana. Still, the Halos should have some at-bats available at first base and DH, as Ohtani and Pujols are hardly locks for 150 games apiece. And theoretically, Santana could try to fake it at third base as he did in 119 innings for the Phillies this year.
- Rangers: With Shin-Soo Choo locked in at DH, the Rangers could acquire Santana as a replacement for first baseman Ronald Guzman. It might be too early to give up on the 24-year-old Guzman, and the Rangers have stronger needs on the pitching staff and at catcher. Still, if they’re simply looking to get better next year in any way possible, replacing Guzman with Santana should at least be on the table.
- Marlins: This is an outside the box option, since most of the focus with the Marlins is on which veteran pieces they’ll sell off as their rebuild continues. The team does have a few internal options at first base for next year such as Peter O’Brien and Garrett Cooper. Marlins president of baseball operations Michael Hill said a month ago, “We’re going to look at internal candidates, and we’re going to look at external candidates.” Why not Santana? For one thing, a trade can work well for a rebuilding club seeking a veteran boost, since free agents are typically reluctant to sign unless such a team overbids. Plus, the Marlins arguably have the payroll space to take on Santana’s entire contract, especially if they unload players like J.T. Realmuto, Dan Straily, and Derek Dietrich. In taking on all $35MM, the Marlins could demand that the Phillies throw in a quality prospect. It’s still a long shot scenario for the division-mates to match up on a Santana deal, however.
- Orioles: The Orioles are stuck with Chris Davis through 2022, unless they’re willing to release him. They’ve also got Trumbo under contract for one more year. Adding Santana only makes sense in the same vein as the Marlins: take the entire contract, and get a quality veteran hitter plus a prospect.
- Tigers: The Tigers could slot Miguel Cabrera in at DH and acquire Santana for first base. They’ve got the payroll space for Santana, at least compared to historical spending. But a bargain option makes more sense here unless the Phillies offer something enticing, putting the Tigers in the same group as fellow rebuilders like the Marlins and Orioles.
- Red Sox: The Red Sox have first baseman Mitch Moreland under contract for $6.5MM for 2019 and J.D. Martinez locked in at DH. The most likely path is just bringing back Steve Pearce as Moreland’s right-handed hitting complement, but the Sox could theoretically acquire Santana and plug him in as the everyday first baseman. Doing so would likely make the team better, though a first base switch doesn’t appear to be an offseason priority. Plus, acquiring Santana would worsen Boston’s luxury tax penalty.
- Yankees: The Yankees have Luke Voit and Greg Bird as first base options, and Giancarlo Stanton spending at least some of his time at DH. There’s no real point to replacing Voit with Santana, and the Yankees have bigger needs, so this match appears unlikely.
- Royals: The Royals don’t have anyone at first base or DH that would preclude an acquisition of Santana. But with the team looking to cut payroll, trading for Santana hardly makes sense.
2018 Non-Tender Candidates
More than 200 players are eligible for salary arbitration this offseason, and the deadline to tender each of these players a contract for the 2019 season is November 30th. That also represents the deadline to inform arbitration eligible players whether they will receive a (non-guaranteed) contract, or else become free agents. The two parties will have another roughly two months to work out salaries before arbitration hearings (if necessary) kick off in February.
As we do each year at MLBTR, we’re providing a list of players whose teams could potentially elect not to tender them a contract, thus sending them into the free-agent pool earlier than expected. It should be emphasized that we’re not indicating that each of these players is likely to be non-tendered (though that’s certainly the case with some of them). Typically, we list any player for which we can envision at least atr ar 10-20 percent chance of a non-tender.
It should be noted that many of the borderline non-tender candidates below will be traded this month rather than simply cut loose. Other borderline candidates may be presented with an offer that is notably lower than their projections and could accept the “take it or leave it” ultimatum rather than being non-tendered.
For a full list of each team’s arb-eligible players, you can check out Matt Swartz’s team-by-team arbitration salary projections.
Position Players
Ehire Adrianza (Twins, $1.8MM)
Aaron Altherr (Phillies, $1.6MM)
Tim Beckham (Orioles, $4.3MM)
Justin Bour (Phillies, $5.2MM)
Cheslor Cuthbert (Royals, $1.1MM)
Travis d’Arnaud (Mets, $3.7MM)
Delino DeShields Jr. (Rangers, $1.9MM)
Adam Duvall (Braves, $3.1MM)
Wilmer Flores (Mets, $4.7MM)
Avisail Garcia (White Sox, $8.0MM)
Leury Garcia (White Sox, $1.9MM)
Greg Garcia (Padres, $900K)
Robbie Grossman (Twins, $4.0MM)
Gorkys Hernandez (Giants, $1.6MM)
Chris Herrmann (Astros, $1.5MM)
Caleb Joseph (Orioles, $1.7MM)
Erik Kratz (Brewers, $1.7MM)
Sandy Leon (Red Sox, $2.3MM)
Jake Marisnick (Astros, $2.4MM)
James McCann (Tigers, $3.5MM)
John Ryan Murphy (Diamondbacks, $1.1MM)
Chris Owings (Diamondbacks, $3.6MM)
Hernan Perez (Brewers, $2.7MM)
Josh Phegley (Athletics, $1.2MM)
Miguel Rojas (Marlins, $2.6MM)
Addison Russell (Cubs, $4.3MM)
Tyler Saladino (Brewers, $1.0MM)
Jonathan Schoop (Brewers, $10.1MM)
Yangervis Solarte (Blue Jays, $5.9MM)
Cory Spangenberg (Padres, $2.3MM)
Devon Travis (Blue Jays, $2.4MM)
Tony Wolters (Rockies, $1.1MM)
Pitchers
Matt Andriese (Diamondbacks, $1.1MM)
Chad Bettis (Rockies, $3.2M)
Eddie Butler (Rangers, $900K)
Brian Flynn (Royals, $1.0MM)
Sam Freeman (Braves, $1.5M)
Luis Garcia (Phillies, $1.7MM)
Yimi Garcia (Dodgers, $900K)
Jesse Hahn (Royals, $1.7MM)
Tom Koehler (Dodgers, $2.0MM)
Shelby Miller (Diamondbacks, $4.9MM)
Bryan Mitchell (Padres, $1.2MM)
Neil Ramirez (Indians, $1.3MM)
Tanner Roark (Nationals, $9.8MM)
Zac Rosscup (Dodgers, $800K)
Chris Rusin (Rockies, $1.7MM)
Chasen Shreve (Cardinals, $1.2MM)
Sammy Solis (Nationals, $900K)
Tyler Thornburg (Red Sox, $2.3MM)
Jonny Venters (Braves, $1.5M)
Offseason Outlook: Chicago White Sox
MLBTR is publishing Offseason Outlooks for all 30 teams. Click here to read the other entries in this series.
The White Sox will make pitching additions as they begin to see the light at the end of the rebuilding tunnel, and have the payroll flexibility to pursue the biggest names in free agency if they so choose.
Guaranteed Contracts
- Welington Castillo, C: $7.75MM through 2019. Includes club option for 2020.
- Nate Jones, RP: $4.65MM through 2019. Includes club options for 2020 and ’21.
- Tim Anderson, SS: $23.15MM through 2022. Includes club options for 2023 and ’24.
Arbitration-Eligible Players (projections via MLBTR contributor Matt Swartz)
- Jose Abreu, 1B – $16MM
- Avisail Garcia, RF – $8.0MM
- Yolmer Sanchez, 3B – $4.7MM
- Carlos Rodon, SP – $3.7MM
- Matt Davidson, DH/1B/3B – $2.4MM
- Leury Garcia, OF – $1.9MM
- Non-tender candidates: Avisail Garcia, Leury Garcia, Davidson
Free Agents
[Chicago White Sox Depth Chart; Chicago White Sox Payroll Overview]
With two rebuilding years in the books, the White Sox figure to make a push toward opening their next competitive window this winter. 2019 might serve as a transitional year, with higher expectations and at least some small chance of reaching the playoffs. GM Rick Hahn explained in September, “We’ve made no secret that when the time comes for as we’ve described adding more finishing pieces that we knew those were going to have to come via free agency. While we are not yet in a position realistically to be adding so called finishing pieces, we are in a position where we need to be opportunistic with regards to the free agent market.”
Let’s take a look at the White Sox payroll situation. With only Castillo, Jones, and Anderson under contract for a total of $13.3MM in 2019, it’s wide open. We project the team’s six arbitration eligible players to total around $36.7MM, though the team could easily jettison Avisail Garcia, Leury Garcia, and Davidson if they feel they have better options. So the team’s likely commitments are in the $38-50MM range. An Opening Day 25-man roster payroll in the range of $110-120MM is plausible, based on the team’s historical spending. Bottom line: this team can afford just about any contract.
In 2018, catching duties were handled by Omar Narvaez, Kevan Smith, and Welington Castillo. Smith has already been lost to the Angels on a waiver claim. Narvaez, 27 in February, has shown himself to be a capable hitter over the last two years. He’s also been one of the game’s worst pitch framers and isn’t adept at throwing out attempted thieves. Castillo was signed a year ago to take on primary catching duties, but he was popped in late May with an 80-game suspension for PED use. The team is set to roll in 2019 with a Castillo-Narvaez tandem, with top catching prospect Zack Collins waiting in the wings.
Jose Abreu just finished his fifth season as Chicago’s first baseman. Abreu, 32 in January, has offered a stabilizing veteran presence for the White Sox. GM Rick Hahn has surely fielded offers over the years, but Abreu’s skillset isn’t one that would likely draw a large return on the trade market. Now, he has only one year remaining until free agency and an ever-growing salary. There’s no reason to push for an upgrade or trade this winter, but any contract extension would have to be fairly modest in nature.
Yoan Moncada, just 23 years old, put in his first full season as the White Sox second baseman. The results were a mixed bag, with about league average offense and the third-highest strikeout rate in baseball. It was still a decent season. The idea of trying Moncada at third base or even center field has been broached, but may not be necessary for 2019. Similarly, shortstop Tim Anderson, 25, put in a useful campaign but still has room to grow. One of the two, more likely Moncada, may be pushed soon by 2018 first-rounder Nick Madrigal. The Sox deployed Yolmer Sanchez at the hot corner this year, and the 26-year-old did acceptable work holding down the fort defensively and bringing energy to the team. He may be best served back in a utility role.
Clearly, there is room for improvement in the team’s infield. The name on everyone’s mind: Manny Machado. Hahn made a trade offer for Machado in December, despite the shortstop’s impending free agency. Perhaps the idea was to help sell Machado on Chicago in an attempt to sign him before he hit the open market. The 26-year-old would easily plug in on the left side of the infield for the White Sox, though I’m guessing the team would have a slight preference to put Machado at third base rather than his preferred shortstop. Still, I don’t think Anderson’s presence will be a major impediment to a possible pursuit. The White Sox check all the boxes for Machado: they have the interest, need, and payroll space.
Though the franchise has never even done a $70MM contract, let alone one that could be more than five times that, there is precedent from almost 20 years ago. Back in 1996, the White Sox signed slugger Albert Belle to a five-year, $55MM deal that was the largest in baseball history at the time. The deal even included a clause that required Belle to remain one of the “top three salaried players for the life of the deal,” as Claire Smith wrote in the New York Times, or else become eligible for free agency. “We’re not being fiscally irresponsible because we can afford it,” said owner Jerry Reinsdorf at the time. On the other hand, baseball salaries have grown well beyond inflation since 1996. $55MM in 1996 is the same as $88MM now – not $350-400MM.
Beyond that, a push for Machado would be slightly wasted if the team wasn’t otherwise built up to contend in 2019 with major pitching additions. Rebuilding teams have certainly signed star players “early” in the past, but getting a five-plus win season from Machado in 2019 is a key part of signing him. So the work wouldn’t be done with just Machado. The Sox could, of course, also look to upgrade at third base with someone other than Machado. They could attempt to trade for Maikel Franco, Kyle Seager, or Jake Lamb or sign Josh Donaldson or Mike Moustakas, for example.
Avisail Garcia is the incumbent in right field. Garcia had multiple DL stints for a hamstring injury this year and was scheduled for knee surgery in October. He’s been a replacement level player for his entire career outside of 2017, and he projects for an $8MM salary in his final season before free agency. Keeping him and hoping for a rebound is a reasonable gamble given the team’s payroll space, but the White Sox could also trade or non-tender Garcia if they are thinking bigger. Like maybe Bryce Harper bigger? The rationale for Harper is much the same as Machado. That said, the White Sox have a long and often contentious history with Harper’s agent, Scott Boras. I don’t know whether Reinsdorf has an appetite for tangling with him on a record-setting contract for Harper, but it’s not out of the realm of possibility.
Left field was manned by many different players for the White Sox in 2018, mainly Nicky Delmonico, Charlie Tilson, Leury Garcia, and Daniel Palka. The team received little production from these players, though Palka showed big power against right-handed pitching. Generally, everyone was just keeping the seat warm for Eloy Jimenez, who is MLB-ready and currently rates as the third-best prospect in baseball. Jimenez figures to finally get the call in late April, allowing the White Sox to control him for the better part of the next seven seasons. Even as a rookie, he might be the team’s best player. Jimenez could be an option at either outfield corner, and he’ll surely be a regular once he’s promoted.
Palka, 27, was a nice waiver claim for the White Sox a year ago. He hit 27 home runs in 449 plate appearances for the Sox this year, and even with a lot of strikeouts and scarce walks, his power plays against right-handed pitching. His defense needs work, and he’s yet to show that he can hit lefties in the Majors. He’s an option to replace or platoon with Garcia in right field, but may be better served in a DH platoon with Matt Davidson. Depending on whether the Sox want to keep Garcia and how they feel about Palka’s defense, they could turn to the market for a better outfielder to pair with Jimenez. Michael Brantley, Andrew McCutchen, and Marwin Gonzalez are the best non-Harper options in free agency. Hahn could also go down a tier to the likes of Adam Jones or Nick Markakis, though neither projects as a difference-maker on the field next year. The trade market has a few decent options, perhaps including David Peralta, Nicholas Castellanos, Jose Martinez, Yasiel Puig, Kyle Schwarber, and Wil Myers.
The White Sox gave most of their center field playing time to Adam Engel, who got the job done defensively but served as one of the worst hitters in baseball. A.J. Pollock is the only real free agent option. He’d be a good fit for the Sox, except that they’d have to forfeit their second-highest draft pick and have their international signing bonus pool reduced by $500K since Pollock received a qualifying offer from the Diamondbacks. There’s a price at which that makes sense. The Sox could also hit the trade market, perhaps for someone semi-interesting like Michael A. Taylor or Odubel Herrera.
The team also must weigh the considerable number of outfield prospects who could arrive in the Majors about a year after Jimenez: Luis Robert, Blake Rutherford, Luis Alexander Basabe, Micker Adolfo, and Luis Gonzalez. There’s an argument for simply adding a stopgap veteran to improve depth in 2019, and then evaluating which prospects are MLB ready for the following season.
The White Sox gave most of their DH time to Davidson and Palka this year. The pair can make for an effective platoon. Still, if the White Sox don’t mind tying up the spot with one player, Nelson Cruz would give an excellent boost to the offense without a long-term commitment or loss of a draft pick.
With James Shields hitting free agency, the White Sox are poised to lose their 2018 innings leader in the rotation. They also lost top young pitcher Michael Kopech to Tommy John surgery in September. Reynaldo Lopez, 25 in January, authored a dominant finish (five runs in his last 40 innings) to push his ERA under 4.00 for the year. The Sox surely hope he’ll be a rotation fixture for the next five years or more. Carlos Rodon, 26 in December, is under team control for three more seasons. He limped to the finish line, allowing 28 earned runs over his last 27 1/3 frames. Both pitchers are locked in for 2019, despite middling peripheral stats that should temper enthusiasm.
It’s difficult to find the bright spots in Lucas Giolito‘s season. The 24-year-old righty put up a 6.13 ERA, 6.5 K/9, 4.7 BB/9, 1.40 HR/9, and a 44.4% groundball rate in 32 starts. Nonetheless, it sounds like Giolito is penciled in for 2019. I imagine he won’t get another 32 starts if he doesn’t take a step forward. Dylan Covey, a 27-year-old former first rounder, had a few flashes of brilliance and should be in the rotation mix. Top White Sox pitching prospect Dylan Cease moved up to Double-A in June and dominated, suggesting a 2019 MLB debut. Dane Dunning should arrive in 2019, as could Jordan Stephens. The team’s 2015 first-round pick, Carson Fulmer, struggled mightily at both Triple-A and the Majors, and will have to pitch his way back into the picture.
Some kind of addition makes sense for this rotation. Again, there’s really no one the White Sox can’t afford. They can throw big money at Patrick Corbin, Dallas Keuchel, or Nathan Eovaldi, or look at more affordable options, including Hyun-Jin Ryu, Gio Gonzalez, Anibal Sanchez, Matt Harvey, Trevor Cahill, Lance Lynn, Wade Miley, or even Shields. If he can be sold on Chicago, 27-year-old lefty Yusei Kikuchi would fit better into the team’s likely window of contention. Garrett Richards would be another forward-looking pickup, since he should return from Tommy John surgery in 2020. The trade market could include Tanner Roark, Sonny Gray, Marcus Stroman, Alex Cobb, Robbie Ray, Dylan Bundy, and Julio Teheran.
Hahn spoke recently of the need to “augment the rotation and the bullpen” this winter, and picked up former top prospect Manny Banuelos as a possible bullpen option. Holdovers in the bullpen will likely include Nate Jones, Jace Fry, Aaron Bummer, and Juan Minaya. DH/first baseman Matt Davidson could contribute more as a mop-up man, which would be a fun story. The Sox also have interesting options who reached the Majors this year in Ian Hamilton, Jose Ruiz, Thyago Vieira, Ryan Burr, and Caleb Frare. Tommy John recipient Zack Burdi could join the mix. I wouldn’t expect the White Sox to spring for Craig Kimbrel, but there’s a slew of solid options they can go after in free agency depending on their willingness to spend.
The White Sox payroll situation cannot be stressed enough: they could theoretically add Machado ($30MM projected annual salary), Corbin ($21.5MM), Pollock ($15MM), and Jeurys Familia ($10MM) and still have a payroll within their historical norms. Most likely, though, the White Sox are a year too early to go nuts in the offseason. If the team falls short on or ignores Machado and other big names, fans can still dream on a strong 2019-20 free agent class.
Photo courtesy of USA Today Sports Images.
Top 50 Free Agents Chat With Tim Dierkes
MLBTR’s Top 50 Free Agents list with contract and team predictions was published Friday. Tim Dierkes and special guest Steve Adams discussed the list in a live chat, and you can read the transcript here.
2018-19 Top 50 MLB Free Agents With Predictions
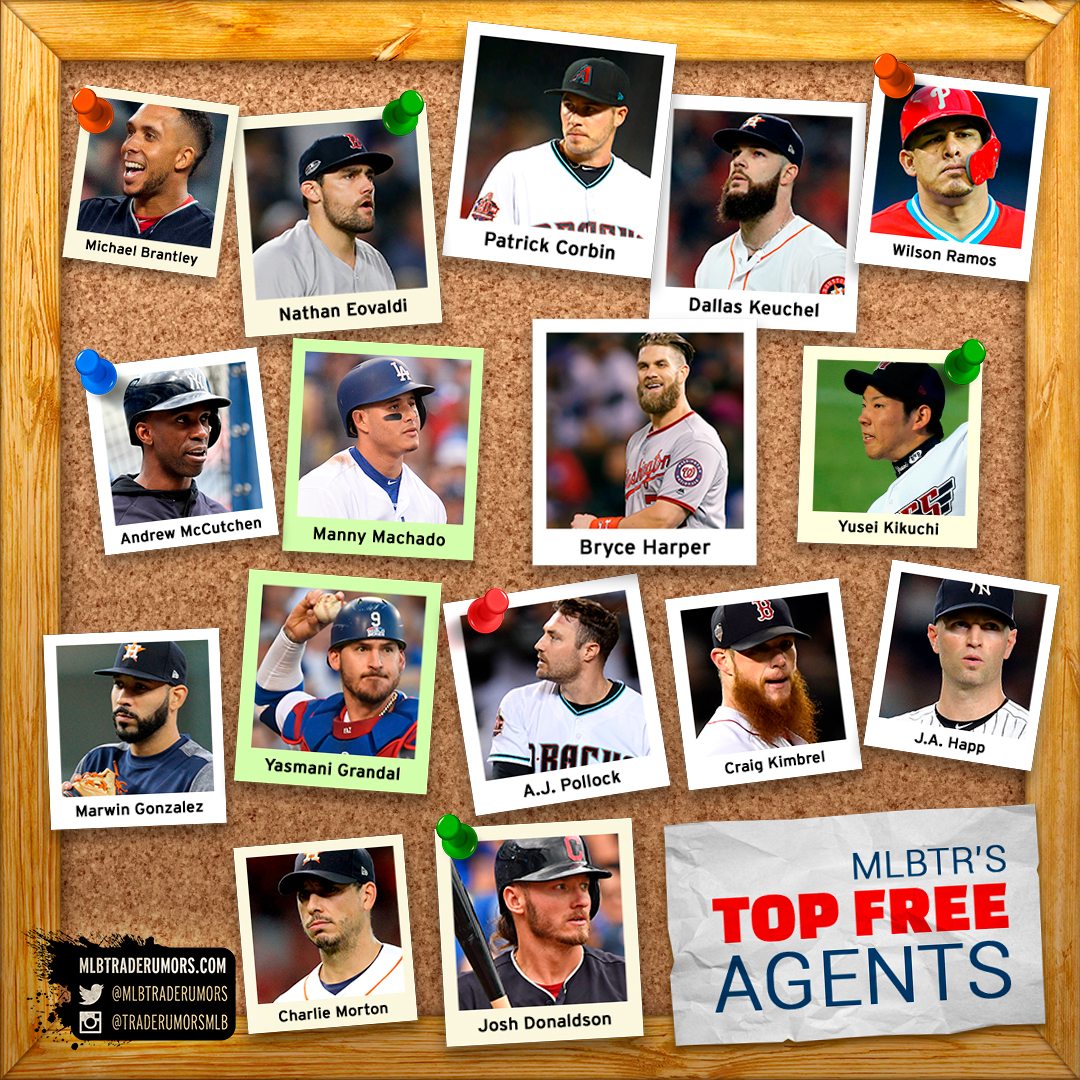
MLB Trade Rumors is proud to present our 13th annual Top 50 Free Agents list! For the entire list of free agents, plus the ability to filter by signing status, position, signing team, and qualifying offer status, check out our mobile-friendly free agent tracker here.
New to MLBTR? You can follow us on Twitter, like us on Facebook, follow us on Instagram, and download our free app for iOS and Android.
MLBTR writers Steve Adams and Jeff Todd joined me in this collaboration, debating free agent contracts and destinations for many hours. We vetted these as much as possible, but with 50 predictions and a volatile free agent and trade marketplace, we know we’ll be off on some. Let us know what you think in the comment section! On to our Top 50 free agents:
1. Bryce Harper – Dodgers. Fourteen years, $420MM. Labeled a baseball prodigy at age 16, Harper was so good he chose to leave high school after two years and enroll in a junior college, fast-tracking him into the 2010 MLB draft. He went first overall to the Nationals and made his MLB debut as a 19-year-old, winning Rookie of the Year in 2012. In his seven seasons with the Nats, Harper made six All-Star teams and won the NL MVP in 2015.
Harper was easily the best hitter in baseball in 2015, though his only other top 10 finish in wRC+ was in 2017. As absurd as it sounds, it feels like Harper should have accomplished more in his seven seasons with the Nationals. A typical three-year look back (inconvenient given the timing of Harper’s monster year) places him just 34th among position players in FanGraphs Wins Above Replacement. Though he’s faced three significant injuries at different points in his career, Harper has mostly quieted health concerns by playing in at least 147 games in three of the last four seasons. A right fielder by nature, Harper has also dabbled at the other outfield positions during his Nationals career.
The Mike Trout-Bryce Harper debate has been settled, but Harper can reasonably be considered one of the 15 best hitters in baseball. He’s a middle of the order left-handed bat with the ability to hit 35-40 home runs and draw 120 walks. He also has a limitless ceiling, as evidenced by his MVP campaign. That brings us to his long-anticipated free agency. Given his unique path to the Majors and choice not to sign an extension with the Nationals, Harper reaches free agency having just celebrated his 26th birthday. There’s some similarity to Alex Rodriguez’s epic free agency, in which A-Rod signed a 10-year, $252MM deal with the Rangers and made his debut with them several months before turning 26. Though Harper is not as accomplished as Rodriguez was, he’s still in position to sign the largest contract in baseball history. Harper comes with a qualifying offer, though that won’t deter his suitors.
The current contract record belongs to Giancarlo Stanton, who signed a 13-year, $325MM extension with the Marlins four years ago — two years before the slugger was slated to reach free agency. The free agent contract records both belong to A-Rod, who topped his own $252MM benchmark by signing for $275MM after the 2007 season. Those three contracts and many other megadeals included opt-out clauses, which have become de rigueur for marquee players. Harper is represented by Scott Boras, outspoken negotiator of many of the game’s largest free agent contracts. We’re predicting that Harper may take a page from the Stanton contract, and set aside average annual value records in search of maximum total dollars. Strange as it sounds, an unheard-of 14-year term could benefit both sides, pushing Harper up past the coveted $400MM mark but limiting his luxury tax hit to a relatively reasonable $30MM per year. A well-placed opt-out clause or two would have immense value to the player as well.
The Nationals may yet make a play to retain Harper, but otherwise, more teams can afford him than you might think. We see the Dodgers, Cubs, Phillies, Yankees, Giants, and Cardinals as the most likely suitors. The Cubs were the pick here until the very end, and they are still a good match, but payroll concerns pushed us to switch to the Dodgers. The Braves are a long shot for Harper, but we should note that they have the means to sign him and an opening in right field. While it may seem hard to fathom, it is also worth noting that there are a few rebuilding teams, such as the Tigers, that could afford Harper (or Machado). Whether or not any will seriously consider such a bold move is unknown, but you can bet that Boras will pitch them on the idea in order to build up the market. And it is worth bearing in mind that he ended up placing Eric Hosmer on the Padres last winter.
Signed with Phillies for thirteen years, $330MM.
2. Manny Machado – Phillies. Thirteen years, $390MM. As generational as Harper’s free agency may be, Machado’s case is just as compelling. Machado, only 102 days older than Harper, draws significant value from his ability to play on the left side of the infield. A shortstop by choice, Machado spent the bulk of his career as a Gold Glove defensive third baseman with the Orioles. He was derailed with knee injuries in 2013-14 but averaged 159 games in the following four seasons. The Orioles (and eventually Dodgers) gave Machado his preferred shortstop position in his contract year, and results were mixed. Machado’s defense at shortstop seemingly improved after leaving Baltimore, but there’s not much data to go on. It’s unclear whether Machado will force the issue and demand to play shortstop for his next team, or if he’ll be open to returning to third base. Machado comes free of a qualifying offer by virtue of his midseason trade.
Beginning in 2015, Machado blossomed into an excellent hitter. In fact, he hasn’t been far off Harper’s pace in recent years despite a down 2017. Given his aforementioned defensive abilities, Machado compares favorably to Harper in WAR over the past three years. Machado may indeed be one of the 10 best position players in baseball heading into 2019, a case which probably cannot be made for Harper. Both players, interestingly, have been perceived as villains by fans in recent years. Machado’s reputation is perhaps more deserved based on recent actions, and the criticism is two-pronged: that he’s a “dirty” player, and that he doesn’t always hustle. The latter charge, which has also been leveled at Harper at times, was worsened by a quote from Machado to The Athletic’s Ken Rosenthal in October in which he admitted, “I’m not the type of player that’s going to be ‘Johnny Hustle.” Machado’s full quote was far more nuanced, as he went on to acknowledge his mistake and expressed desire to improve. Perhaps unsurprisingly, many chose only to focus on the more damning part of the quote — either not knowing or not caring that they weren’t looking at his complete sentiments. As to the “dirty” charge, everyone (teams and fans alike) will have to assess for themselves. These three plays provide evidence to critics, though they certainly aren’t representative of Machado’s daily interactions on the ballfield. The postseason Machado narrative is overblown, as these things always are. But record-setting contracts are ownership-level decisions. If Machado’s current narrative reduces the motivation of even one owner of a potential suitor, as Jon Heyman of Fancred Sports has suggested, it would certainly impact his earning power.
Machado, who is represented by Dan Lozano of MVP Sports Group, projects to land a contract similar to that of Harper. Both players should pass Stanton’s $325MM record. As for which of the two actually does better, we don’t have a clear answer. Machado’s suitors could include the Yankees, Phillies, Cubs, Cardinals, and White Sox.
Signed with Padres for ten years, $300MM.
3. Patrick Corbin – Yankees. Six years, $129MM. No player in recent memory has done more to increase his value in one season than Corbin. The 29-year-old southpaw dominated in his 200 innings for the Diamondbacks this year, posting a 3.15 ERA, 11.1 K/9, and 2.2 BB/9 in 33 starts. Corbin had a breakout year in 2013 for the D’Backs but went down for Tommy John surgery in March 2014. He had some stumbles post-surgery, particularly in 2016, but progressed from solid in ’17 to possibly one of the five best starting pitchers in baseball this year. Corbin’s velocity took a dip in May, setting off alarm bells, but it didn’t seem to affect his performance and actually crept back up past 92 miles per hour in the second half. Corbin ramped his slider usage up past 40 percent this year to great success.
Back in April, before Corbin seemed like a potential $100MM guy, the pitcher admitted to Bob Nightengale of USA Today that it would “definitely be great” to pitch for his childhood team, the Yankees. The Yankees have the money and the need, but teams like the Astros, Braves, Phillies, Nationals, Dodgers, Giants, Angels, and Twins make sense too. With age on his side, we foresee a bidding war taking Corbin up past Yu Darvish money. He has been tagged with a qualifying offer by the Diamondbacks.
Signed with Nationals for six years, $140MM.
4. Dallas Keuchel – Nationals. Four years, $82MM. Keuchel, 31 in January, won the AL Cy Young award in 2015 and has since settled in as a solid but not quite spectacular starting pitcher. He and Corbin were two of only 13 pitchers this year to reach 200 innings. Keuchel is not a big strikeout guy, but the lefty has good control and keeps the ball in the yard due to a ground-ball rate that perennially ranks among the league leaders. His groundball rate actually rose as high as 66.8% in 2017, which was the best in baseball, though it fell back to 53.7% this year. Keuchel’s worm-burning tendencies pair with a sustained knack for limiting hard contact, helping him to limit home runs far better than the league-average pitcher. In 2018, he trailed only Jacob deGrom, Max Scherzer and Zack Wheeler in terms of generating weak contact, and his opponents’ hard-contact rate was the fifth-lowest of any qualified starter (as measured by Fangraphs). That wasn’t a fluke; Keuchel ranks among the best in the league in those regards on a yearly basis.
Keuchel may top out at four years but should command a premium average annual value despite coming with a qualifying offer. His suitors should be similar to those of Corbin.
5. Craig Kimbrel – Cardinals. Four years, $70MM. Kimbrel has been one of the best closers in baseball since taking the job for the Braves in 2011. In his eight full seasons, he’s made the All-Star team seven times and placed in the Cy Young voting five times. Over the past three years, he’s struck out 42.3% of batters faced, leading all MLB relievers. He’s third among relievers during that time with an average fastball of 97.6 miles per hour. Like many closers, Kimbrel’s control is not a strong suit, but he’s so hard to hit that it generally doesn’t matter. We think Kimbrel is more likely to beat Wade Davis’ average annual value record for relievers ($17.33MM) than he is to reach Aroldis Chapman’s record-setting $86MM total. Because Kimbrel signed an extension with the Braves in 2014, he reaches free agency more than a year older than Chapman and Kenley Jansen were when they hit the open market. A return to Boston could be possible, or teams like the Cardinals, Angels, Cubs, Braves, Phillies, Mets, and Twins could get involved. Kimbrel was issued a qualifying offer from the Red Sox.
6. Yasmani Grandal – Nationals. Four years, $64MM. Grandal is the best available free agent catcher. He turns 30 in November and his 116 wRC+ ranks fourth among all catchers from 2016-18. He’s second among all catchers with 73 home runs during that time. Grandal is a switch-hitter and is above average against both righties and lefties. Though Grandal took his lumps defensively in the postseason and does allow a lot of passed balls, he’s one of the game’s best pitch framers and has been above-average in terms of caught-stealing rate over the past four seasons. Overall, Grandal is one of the better catchers in baseball, and he has a shot at the five-year contract standard reached by Brian McCann and Russell Martin. While many teams will prefer trading for Marlins backstop J.T. Realmuto to signing Grandal, only one can get Realmuto and the prospect cost will be substantial. The Dodgers have issued Grandal a qualifying offer but could otherwise move on. The Nationals, Rangers, Twins, Red Sox, Astros, Angels, Phillies, Mets, Braves, and Rockies could be suitors.
Signed with Brewers for one year, $18.25MM.
7. Nathan Eovaldi – Red Sox. Four years, $60MM. Eovaldi, 29 in February, has long been one of the hardest-throwing starting pitchers in baseball. He averaged 97.2 miles per hour on his fastball this year, second only to Luis Severino and Noah Syndergaard. The key piece for the Marlins in the 2012 Hanley Ramirez trade with the Dodgers, Eovaldi moved on to the Yankees in a 2014 swap. He went down for his second Tommy John surgery in August 2016 (his first one was in high school). Eovaldi remained in the AL East this season, working for the Rays and Red Sox. Despite the premium velocity, 2018 was the first season Eovaldi managed to strike out more than 20 percent of the batters he faced. Even more than last year’s early-market darling, Tyler Chatwood, Eovaldi is a tantalizing power arm with remaining unlocked potential and figures to be a popular free agent. That popularity could push the bidding to four years despite the fact that a player with this lack of durability has never reached that plateau. The Red Sox could try to bring him back, and otherwise the Astros, Rangers, Braves, Phillies, Nationals, Dodgers, Angels, Giants, and Yankees could be in the mix.
Signed with Red Sox for four years, $67.5MM.
8. A.J. Pollock – Giants. Four years, $60MM. Like fellow free agents Bryce Harper, Manny Machado, Josh Donaldson, Andrew McCutchen, and Matt Harvey, Pollock was one of the best MLB players of 2015. Unfortunately, that was the only time Pollock exceeded 113 games in the past five seasons. His injuries have run the gamut: a broken hand, an elbow fracture, a groin strain, and this year a thumb fracture. Pollock, 31 in December, just doesn’t seem to have the durability to merit the five-year deals landed by Lorenzo Cain and Dexter Fowler, even if some of his injuries have been fluky in nature. Nonetheless, he put up a healthy 110 wRC+ with the bat this year and reached 134 at his peak. He also plays an acceptable center field in a free agent market where the only real alternative is Adam Jones. The Giants, White Sox, Indians, and Phillies could be possibilities, though Pollock comes with a qualifying offer attached.
Signed with Dodgers for four years, $55MM.
9. J.A. Happ – Angels. Three years, $48MM. Happ, 36, has emerged as one of the top starting pitchers in this free agent class. The lefty experienced a career resurgence upon a 2015 trade to the Pirates, with success that largely continued throughout a subsequent three-year contract with Toronto. Happ was dealt to the Yankees in July of this year and recorded a 2.69 ERA in 11 starts. He can be prone to the long ball, but Happ put up a career-best strikeout rate this year and generally limits walks. Rich Hill was signed through his age-39 season, so it’s plausible Happ could be inked through age 38 on his own new three-year pact. Quite a few contending teams could see value in installing the quality veteran, particularly those that fail to land or aren’t enamored of higher-priced options.
Signed with Yankees for two years, $34MM.
10. Michael Brantley – Braves. Three years, $45MM. Brantley, 32 in May, hit .305/.362/.459 over the last two seasons as the Indians’ left fielder. He has spent his entire Major League career in the organization following his inclusion in the 2008 CC Sabathia trade with Milwaukee. The concern is Brantley’s health, as he was limited to 101 games from 2016-17 due to shoulder, biceps, and ankle injuries, all of which involved surgery. He still should have enough interest to land a three-year deal coming off a 143-game season in which he was typically excellent at the plate. The Indians could bring him back if they can fit him into the budget, though they chose not to issue a qualifying offer. He’ll otherwise have a similar market to McCutchen, though Brantley hits from the left side and has historically carried fairly notable platoon splits.
Signed with Astros for two years, $32MM.
11. Andrew McCutchen – Cubs. Three years, $45MM. Aside from Harper, Brantley and McCutchen are the best corner outfielders on the free-agent market. McCutchen, 32, is several years removed from his MVP-caliber stretch with the Pirates but remains a very good hitter. After nine seasons as the Pirates’ center fielder, McCutchen was traded to the Giants and switched to right field. After hitting only three home runs in the season’s first two months, Cutch went on to hit .259/.374/.447 in his final 452 plate appearances for the Giants and Yankees. He could fit with the Cubs, Indians, Rays, Cardinals, Braves, White Sox, or Phillies.
Signed with Phillies for three years, $50MM.
12. Yusei Kikuchi – Padres. Six years, $42MM. Kikuchi, a 27-year-old lefty starter, has pitched for Japan’s Seibu Lions for the past eight years. The Lions will reportedly honor Kikuchi’s request to be posted this winter, thus freeing him to negotiate with any MLB team. He battled shoulder issues this year and has only once exceeded this season’s innings total of 163 2/3. Kikuchi profiles as a mid-rotation arm in MLB. He’ll be the first player subject to the new NPB-MLB posting agreement, which should serve to lower fees for MLB teams by tying the player’s release fee to the size of his contract. For example, a $42MM contract would result in a release fee of $7.975MM, placing the total commitment in this scenario around $50MM. Kikuchi will draw interest from contenders and rebuilding clubs alike.
Signed with Mariners for four years, $56MM.
13. Josh Donaldson – Cardinals. One year, $20MM. Donaldson, 33 in December, presents a potential impact bat on a short-term deal. He’s a late blooming third baseman who became a star for the A’s in 2013 and won the AL MVP award in 2015 after a trade to the Blue Jays. He missed significant time due to a calf injury in 2017, but went nuts with 22 home runs over the final two months that year. Donaldson hit the DL this year in April with right shoulder inflammation and then went on the shelf again in late May for his calf. That involved a 60-day DL stint, with Donaldson being traded to the Indians before he was activated. Donaldson did make a brief but promising return to action late in 2018 and could land a multi-year deal on the strength of his offensive ability. That said, he’s arguably better served to take a one-year pact and re-establish his health; we’re guessing the famously competitive Donaldson will bet on himself. The Cardinals, Twins, Angels, Phillies, Braves, and White Sox could be options.
Signed with Braves for one year, $23MM.
14. Charlie Morton – Phillies. Two years, $32MM. Morton, 35 in November, emerged as one of baseball’s top dozen strikeout artists (among starters) over the past two years with the Astros. Among those with 300 innings over that span, Morton ranks sixth with a 95.4 mile per hour average fastball velocity. He’s aged like a fine wine, adding velocity and changing his game from the ground-ball pitcher of his Pirates years. Morton, a family man with four children, wasn’t sure as of April whether he’d pitch in 2019. More recently, he’s said he will keep going, adding that he would like to re-sign with Houston. The Astros surprisingly chose not to issue a qualifying offer, which could be an indication that they’re thinking of moving on from Morton for some reason. Morton will entertain many two- or even three-year offers on the open market, especially unencumbered by a QO. If he doesn’t return to the Astros, Morton has cited proximity to his wife’s family in Delaware as a major factor. That could put the Phillies and Nationals as frontrunners.
Signed with Rays for two years, $30MM.
15. Wilson Ramos – Astros. Three years, $36MM. With just a week left in a breakout 2016 contract season, Ramos tore his right ACL — the same one he’d torn four years prior. Dreams of a monster four or five-year deal evaporated, and Ramos took a two-year, $12.5MM guarantee with the Rays. He rounded back into form this year, catching nearly 800 innings for the Rays and Phillies and leading all backstops with a 131 wRC+. The 31-year-old seems primed for a solid three-year deal, perhaps with a team that can give his knees a break with some time at designated hitter. The Astros, Red Sox, Athletics, Angels, Rockies, or Dodgers could work, as could a return to D.C.
Signed with Mets for two years, $19MM.
16. Marwin Gonzalez – Twins. Four years, $36MM. Gonzalez, 30 in March, has been a valuable super utility player throughout his seven-year Astros career. He’s capable of playing all four infield positions, as well as left field, prompting agent Scott Boras to nickname him “Swiss G.” A switch-hitter, Gonzalez has been every bit as productive as McCutchen and Brantley over the last two years, though much of his success is concentrated in a breakout 2017 season. Gonzalez was shockingly one of the dozen best hitters in baseball that year, but dropped back to a 104 wRC+ in 2018. He did at least manage a stronger 122 mark from June onward. Gonzalez has never reached 600 plate appearances in a season, nor has he tallied 700 innings at any one position. Whether it’s as a super utility player or a regular, Gonzalez is an easy fit onto more than half the rosters in baseball. The Twins, Cubs, Angels, Brewers, Tigers, Blue Jays, Phillies, Nationals, and Rockies are among the many fits.
Signed with Twins for two years, $21MM.
17. Jeurys Familia – Twins. Three years, $33MM. Familia, 29, excelled as the Mets’ closer from 2015-16, posting a 2.20 ERA and 9.8 K/9 in 155 2/3 innings. He was arrested on a domestic violence charge in November 2016, but the charge was dismissed the following month. The following year, MLB gave a statement on the matter and suspended Familia for 15 games. Early in the 2017 season, Familia was diagnosed with an arterial clot in his right shoulder, which resulted in surgery and more than three months on the DL. This year, Familia hit the DL in June for shoulder soreness, though he missed the minimum 10 days. He closed out his season in Oakland after a July trade to the A’s. Only a dozen relievers threw harder than Familia this year, and he could even be popular enough to warrant a four-year deal.
Signed with Mets for three years, $30MM.
18. Zach Britton – Astros. Three years, $33MM. Britton might have been the best reliever in baseball upon the conclusion of his dominant 2016 season for the Orioles. The lefty had allowed just four runs in 67 innings, generating ground-balls at a historic 80 percent rate — the highest mark since the stat began being tracked. However, a strained forearm cropped up in April 2017, which quickly recurred after he was activated from the DL in May. He missed two months after that and was also shut down early in September with a knee injury. Worse yet, Britton ruptured an Achilles tendon in December 2017, delaying his 2018 debut until June 12th. He joined the Yankees’ elite bullpen in a July deal. Despite a 3.00 ERA over the past two seasons, Britton’s 7.3 K/9 and 4.5 BB/9 were unimpressive. However, he’s still throwing over 95 miles per hour from the left side, and he’s still getting ground-balls more than 70 percent of the time. Given Britton’s three-year stretch of dominance as the Orioles’ closer from 2014-16, his market should be robust even if he’s yet to return to form. There might not be a better arm to dream on in the current class. The Astros, Cubs, Red Sox, Twins, Angels, Cardinals, Mets, Phillies, and Dodgers could be involved.
Signed with Yankees for three years, $39MM.
19. David Robertson – Mets. Three years, $33MM. Robertson, 34 in April, has been a paragon of durability, pitching 60+ relief innings in each of the past nine seasons. He became the Yankees’ closer in 2014, serving in that role for the White Sox as well until being traded back to New York in 2017. Robertson is difficult to hit and continually puts up huge strikeout rates, getting the most out of a fastball in the 92 mile per hour range due to incredible extension. Robertson has made the interesting choice to represent himself in free agency, and we think he has a good case for a three-year deal despite the fact that he’s entering his mid-30s. Robertson, Jeurys Familia, Zach Britton, and Adam Ottavino make up a second tier of relievers who should do quite well in free agency.
Signed with Phillies for two years, $23MM.
20. Hyun-Jin Ryu – Dodgers. Three years, $33MM. After dominating the Korea Baseball Organization with the Hanwha Eagles from 2006-12, Ryu was posted for MLB teams, and the Dodgers won his negotiating rights. The two sides hammered out a six-year deal, which went quite well for the first two seasons. Unfortunately, the big lefty made just one big league start from 2015-16 due to shoulder and elbow injuries. Those issues are in the rearview, but Ryu still only made 39 starts from 2017-18 due to hip, foot, and groin injuries. That said, Ryu was excellent in his 82 1/3 regular season innings this year, posting a 1.97 ERA, 9.7 K/9, and 1.6 BB/9. Given his injury history, teams may be reluctant to commit a third year to Ryu, who enters his age-32 season. However, that might be the cost of doing business given his success when he does pitch. He’ll need a team willing to tolerate health risk, and a return to the Dodgers could make sense for both sides. The Dodgers are obviously already rife with rotation options, but no team in the game has prioritized rotation depth — or shown a willingness to take health risks — like Los Angeles in recent seasons. And, retaining Ryu could make it easier for them to explore trading from that depth as they pursue other upgrades. The Dodgers’ choice to issue Ryu a qualifying offer suggests they are indeed interested in a “Ryu-nion.” Sorry, had to do it.
Accepted one-year, $17.9MM qualifying offer from Dodgers.
21. Adam Ottavino – Yankees. Three years, $30MM. Ottavino, 33 in November, will use an excellent contract year as a springboard to a strong contract. Originally a Cardinals first-round draft pick, Ottavino had some success out of the Rockies’ bullpen from 2012-14 before requiring Tommy John surgery in May 2015. He came back strong for the second half of 2016 but hit the DL in May 2017 with shoulder inflammation. That became a lost year in which Ottavino walked more than 16 percent of batters faced. Then, as wonderfully detailed by Travis Sawchik for FanGraphs, Ottavino rebuilt himself out of a vacated Nine West shoe store during the 2017-18 offseason using advanced technology. He went on to rank eighth among qualified relievers in strikeout percentage (36.1 percent) and should be able to land a three-year deal.
Signed with Yankees for three years, $27MM.
22. Nelson Cruz – Twins. Two years, $30MM. Cruz, 38, has averaged 41 home runs per season over the past five years for the Orioles and Mariners. Though he is easily one of the best available bats, he’s strictly a designated hitter at this stage in his career. The Mariners, who are tight on payroll space, might choose to let him leave. American League contenders with fully open DH spots are hard to come by, but the Twins, Astros, White Sox, and Royals could be options. Because Cruz has previously received a qualifying offer in his career, the Mariners aren’t able to issue one when it would otherwise look likely. That he is free of draft-pick compensation certainly doesn’t hurt his case.
Signed with Twins for one year, $14.3MM.
23. Jed Lowrie – Athletics. Three years, $30MM. Only two second basemen — Jose Ramirez and Jose Altuve — have been better than Lowrie by measure of WAR over the past two seasons. Injury and performance issues had clouded Lowrie’s outlook, but since the start of 2017 the switch-hitter boasts a 121 wRC+ and has appeared in 310 games. Lowrie will turn 35 next April, however, so he’ll be fighting to land a third year on his contract. There’s mutual interest in a return to Oakland, while the Twins, Orioles, Blue Jays, Angels, Cubs, Brewers, Nationals, Rockies, and Dodgers could also be in the mix. We think his value could max out at three years, but it’s also possible he takes a slightly more team-friendly two-year pact with Oakland.
Signed with Mets for two years, $20MM.
24. Andrew Miller – Red Sox. Three years, $27MM. Britton and Miller are the top lefty relief options on the market, and both should do well based more on past success than on their 2018 results. Miller, 33, tallied a 4.24 ERA in 34 innings in a season that was shortened by a hamstring strain, knee inflammation, and a shoulder impingement. He dominated from 2014-17, posting a 1.72 ERA, 14.5 K/9, and 2.3 BB/9 in 261 innings for the Red Sox, Orioles, Yankees, and Indians. He’ll likely have his pick of contending clubs from which to choose.
Signed with Cardinals for two years, $25MM.
25. Joe Kelly – Angels. Three years, $27MM. With an average fastball velocity of 98.1 miles per hour, Kelly is one of the hardest-throwing relievers in baseball. The 30-year-old has struggled to marry that velocity with results, with a problematic walk rate and fewer strikeouts than you might expect. Still, Kelly left a great lasting impression by allowing just one run in 11 1/3 postseason innings for the Red Sox, with 13 strikeouts and no walks. His upside should be tantalizing enough to net him a three-year deal.
Signed with Dodgers for three years, $25MM.
26. Kelvin Herrera – Dodgers. One year, $8MM. Herrera was part of the Royals’ vaunted bullpen trio of 2013-15, along with Greg Holland and Wade Davis. Soon to be 29, the righty owns a 2.82 career ERA, flashing elite strikeout and walk rates at times but not consistently. For example, he walked only two batters in 25 2/3 innings to start the season as the Royals’ closer this year, but had a 3.9 BB/9 after being traded to the Nationals in June. His strikeout rates have been as high as 11.4 per nine and as low as 7.6 per nine. He’s continued to pump 97-98 mile per hour gas all along and would have scored one of the largest relief contracts of the winter, but he went down in late August for surgery on the Lisfranc ligament in his left foot. As of right now, Herrera’s recovery timeline is a total unknown, at least to the public. He’s young enough that a one-year deal, once a timeline is established, will give him a nice opportunity to rebuild his stock in search of a big multi-year deal next winter.
Signed with White Sox for two years, $18MM.
27. Gio Gonzalez – Athletics. Two years, $24MM. Gonzalez, a 33-year-old lefty, can offer stability to the back end of a team’s rotation. He’s averaged 32 starts per year over the past four seasons, mostly with the Nationals. Gonzalez has always had issues with control, but with the right defense and a bit of good fortune he’s capable of a sub-4.00 ERA. While his fastball velocity has fallen off sharply, landing at just over 90 miles per hour over the past two seasons, Gonzalez still gets as many swings and misses as ever. Teams like the A’s, Angels, Reds, Braves, and Giants could be in the mix for a player with this type of stability.
Signed minor league deal with Yankees.
28. Anibal Sanchez – Giants. Two years, $22MM. Sanchez, 35 in February, flourished early in his career with the Marlins and landed a five-year deal with the Tigers after the 2012 season. He finished out that contract with a 5.67 ERA over the final three seasons. The Twins inked him to a cheap, non-guaranteed, one-year deal in February this year and let him go when they signed Lance Lynn in March. Sanchez hooked on with the Braves on a minor league deal. He dealt with a hamstring injury in April but found his way into the Braves’ rotation by late May. Over the season’s final four months, Sanchez posted a 2.81 ERA, 9.0 K/9, and 2.6 BB/9 in 21 starts. By measure of ERA, only nine MLB starters were better, but his success runs much deeper than that. Sanchez adopted a cutter that proved to be a dominant weapon. Astonishingly, no starting pitcher in baseball allowed less hard contact or a lower average exit velocity, by measure of Statcast. His turnaround was legitimately remarkable and could result in a multi-year deal.
Signed with Nationals for two years, $19MM.
29. Matt Harvey – Reds. Two years, $22MM. Though it was interrupted by 2013 Tommy John surgery, Harvey’s early Mets career consisted of 65 starts of 2.53 ERA ball, plus a high point of a dominant start in Game 5 of the 2015 World Series. In 2016, the wheels started to fall off. He hit the DL in July that year with thoracic outlet syndrome, resulting in season-ending surgery. Harvey recovered in time for the 2017 campaign, though he was suspended by the Mets in May after failing to show up for a game. Harvey then hit the DL in June 2017 due to a stress injury to the scapula bone in his right shoulder. The Mets tendered Harvey a contract for 2018 despite the two lost seasons, but he was bumped to the bullpen in April for poor performance. Soon after, he was designated for assignment and traded to the Reds for Devin Mesoraco. Harvey’s performance with the Reds — a 4.50 ERA, 7.8 K/9, 2.0 BB/9, 1.48 HR/9, and 42.6 percent ground-ball rate in 24 starts — wasn’t great. But he avoided the DL and brought his average fastball velocity up into the 95 mile per hour range. At 30 years old in March, Harvey remains a starting pitcher a team can dream on. The Reds declined to trade him this summer, suggesting they’d like to retain him, but some other clubs will also likely view him as a functional back-of-the-rotation arm as well as an upside play.
Signed with Angels for one year, $11MM.
30. Trevor Cahill – Blue Jays. Two years, $22MM. Cahill, 31 in March, began his career with five solid seasons as a starting pitcher for the Athletics and Diamondbacks. His career went sideways in 2014, and he rebooted with success out of the Cubs’ bullpen. Back in the rotation, Cahill showed flashes of brilliance for the Padres and A’s over the past two years. He also logged only 194 innings in that time due to a lower back strain, shoulder injuries, an elbow impingement, and an Achilles injury. Given his 8.7 K/9 and 54 percent groundball rate over the past two seasons, teams might be willing to look past Cahill’s injury history. Pitchers who miss bats and keep the ball on the ground at that rate are hard to come by.
Signed with Angels for one year, $9MM.
31. Daniel Murphy – Angels. Two years, $20MM. Murphy took his offense to another level with a ridiculous 2015 postseason, though his ensuing three-year contract with the Nationals never really lived up to the narrative that his October showing earned him millions. Perhaps it should have, because the improvement was real, and the Nats reaped the benefits with over 10 WAR from 2016-17. Murphy underwent knee surgery in October 2017, and Opening Day optimism disappeared as his recovery dragged out and resulted in a June 12th season debut. After some early scuffling, Murphy posted a 126 wRC+ over the season’s final three months, with the Cubs picking him up for the stretch drive. He’s a high-contact, professional hitter in today’s high-strikeout world. He also turns 34 in April and played a poor second base this year. It’s easy to see him landing in the AL, where he can moonlight at DH in addition to second base and perhaps first base. The Angels and Twins were among the teams we considered when pondering a landing spot.
Signed with Rockies for two years, $24MM.
32. Brian Dozier – Nationals. One year, $10MM. Looking at second basemen from 2014-17, only Jose Altuve was more valuable than Dozier. He compiled nearly 19 WAR for the Twins, smacking 127 home runs in that span. A solid four-year deal seemed possible for Dozier at one point, but his bat just died this year outside of July and August. The Twins shipped him to the Dodgers in the middle of that decent run. Now, the 31-year-old may be best-served looking for a one-year deal and prioritizing playing time as a way to rebuild value.
Signed with Nationals for one year, $9MM.
33. DJ LeMahieu – Tigers. Two years, $18MM. LeMahieu earned the Rockies’ starting second base job in May 2013, keeping the gig by virtue of strong defense despite providing little value at the plate. LeMahieu bumped up his offensive production starting in 2015, peaking with a batting title in ’16. Since then, he’s managed a 90 wRC+, which will likely remain his level for the next few years. The 30-year-old isn’t an exciting option at second base, but he should provide a steady two wins above replacement. LeMahieu has a chance at a three-year deal. If the Rockies let him go the Nationals, Tigers, and Twins could be options.
Signed with Yankees for two years, $24MM.
34. Joakim Soria – Mets. Two years, $18MM. Soria, 34, continues to find success with his combination of a high strikeout and low walk rate. He was able to avoid the long ball despite a precipitous drop in ground-ball rate this season, which he split between the White Sox and Brewers. With a fastball under 93 miles per hour, Soria isn’t a flashy choice, but he still provides plenty of value.
Signed with Athletics for two years, $15MM.
35. Mike Moustakas – Royals. Two years, $16MM. After hitting a Royals-record 38 home runs in 2017, Moustakas’ free agency went terribly awry. Despite a qualifying offer, MLBTR predicted a five-year, $85MM contract. Instead, the third baseman wound up back with the Royals on a one-year, $6.5MM deal. Sam Mellinger, talking to two league sources, said Moustakas turned down approximately $45MM over three years from the Angels. Agent Scott Boras told Mellinger, “There was never a multi-year contract offer made to Mike Moustakas by the Angels or any other major-league team.” Who you believe will color a prediction on what Moose can do this winter, after a slightly worse season but with no qualifying offer. A multi-year contract is a possibility here, but it seems clear today’s GMs don’t value Moustakas’ high-power, low-OBP profile as a premium skill set.
Signed with Brewers for one year, $10MM.
36. Lance Lynn – Rays. Two years, $16MM. Like Moustakas, Lynn was one of the free agents who got body-slammed by the 2017-18 market freeze. MLBTR projected a four-year, $56MM deal for Lynn coming off a solid season for the Cardinals, yet the righty fell to the Twins in March on a one-year, $12MM deal. He struggled in 20 starts for Minnesota, as his already-high walk rate got out of hand. The Twins sent him to the Yankees at the trade deadline. Lynn wound up making nine starts for New York, with a 4.60 ERA but a 2.17 FIP, 3.03 xFIP, 10.0 K/9, and 2.5 BB/9. Despite the small sample, those peripherals are intriguing and should land Lynn a rotation job — if not a two-year deal — somewhere.
Signed with Rangers for three years, $30MM.
37. Cody Allen – Braves. Two years, $16MM. Allen dominated as the Indians’ closer from 2014-17, posting a 2.62 ERA, 12.1 K/9, and 120 saves. This year, an increase in home runs and walks allowed torched his value. Just 30 in November, Allen shouldn’t have a hard time finding a team willing to bet on a return to form. Perhaps his camp even prefers a one-year deal with an eye on reentering the market next season, but multiple years should still be possible if the goal is to take max dollars now.
Signed with Angels for one year, $8.5MM.
38. Nick Markakis – Phillies. Two years, $16MM. Markakis had a couple of excellent early-career years with the Orioles, eventually landing a four-year deal with Atlanta after the 2014 season. The right fielder was a one-win type of player from 2015-17, but then for the first four months of 2018 Markakis unexpectedly posted a 129 wRC+. In truth, he’s probably a league average hitter, and he’ll turn 35 in November. Aging corner bats of this mold have not been valued highly on the free-agent or trade markets in recent years.
Signed with Braves for one year, $6MM.
39. Derek Holland – Reds. Two years, $15MM. Holland, a 32-year-old southpaw starter, had a solid run in the Rangers’ rotation from 2011-13 before injuries torpedoed his next few seasons. Coming off a terrible year with the White Sox in 2017, Holland joined the Giants on a minor league deal in February. Due to injuries to the Giants’ veteran starters, Holland joined the rotation and wound up posting a 3.67 ERA and 8.5 K/9 in 30 starts. His 3.87 FIP and 4.07 xFIP lend some credence to the notion that he’s returned to his status as a viable starter, even if his ceiling seems limited.
Signed with Giants for one year, $7MM.
40. Bud Norris – Indians. Two years, $12MM. Norris, 34 in March, has transitioned successfully from the rotation to the bullpen. This year for the Cardinals, he managed a 3.59 ERA, 10.5 K/9, 3.3 BB/9, 1.25 HR/9, and 42.6 percent ground-ball rate in 57 2/3 innings, including 28 saves. His ERA sat at 2.85 in August 28th and ballooned after a rough week in September. Another factor to consider is that Norris is decidedly old school in the clubhouse, and was revealed as Mike Matheny’s bullpen monitor in Mark Saxon’s July story for The Athletic. A two-year deal seems likely.
Signed minor league deal with Blue Jays.
41. Brad Brach – Brewers. Two years, $12MM. Brach, 33 in April, had success out of the Orioles’ bullpen with a 2.74 ERA and 9.5 K/9 from 2014-17. He even earned an All-Star nod in 2016. After a rough 39 innings to begin his 2018 campaign, Brach was traded to Atlanta. The top line result — a 1.52 ERA — was strong, but Brach’s peripheral stats didn’t support it. He remains a useful righty arm, but his stock took a hit in 2018.
Signed with Cubs for one year, at least $4.35MM.
42. Wade Miley – Brewers. Two years, $12MM. Miley, 32 in November, had a decent run for the Diamondbacks and Red Sox from 2012-15. His ERA jumped to 5.48 from 2016-17 for the Mariners and Orioles, which is why he settled for a minor league deal with the Brewers in February. He sprained his groin in the spring but made his way to the big league club in May. In his second start for the Brewers, Miley strained his oblique, knocking him out for over a month. Once he returned on July 12th, Miley posted a 2.66 ERA, 5.6 K/9, 2.8 BB/9, 0.36 HR/9, and 53.3% ground-ball rate in 74 1/3 innings across 14 starts. Miley had a .274 batting average on balls in play and a 5.7% home run per fly-ball rate during that time, neither of which seems sustainable. It was a useful run for the Brewers, but it’s not clear Miley is a different pitcher than he was before 2018.
Signed with Astros for one year, $4.5MM.
43. Garrett Richards – Tigers. Two years, $10MM. Richards, 30, has spent his entire career with the Angels, with his best work coming in 2014-15. He’s made only 28 starts over the past three seasons after deciding to treat a torn UCL with a platelet-rich plasma injection. He also endured a biceps strain in 2017 and a hamstring strain this year before succumbing to Tommy John surgery in July. The 2019 season is out of the picture for Richards, who could sign a two-year deal in the vein of those inked by Drew Smyly and Michael Pineda. A team would be paying entirely for Richards’ 2020 season. Just about any club that wants to plan ahead and has some payroll space and mild tolerance for risk could be a candidate.
Signed with Padres for two years, $15.5MM.
44. Jesse Chavez – Cubs. Two years, $10MM. Chavez, 35, nearly saved the Cubs’ beleaguered bullpen by posting a 1.15 ERA in 39 innings after coming over in a July trade with the Rangers. Putting the Rays’ Ryan Yarbrough aside, Chavez led MLB with 95 1/3 relief innings. Among relievers with at least 60 innings, Chavez’s 4.5% walk rate was third best. He was much more hittable and homer prone before joining the Cubs, so there is reason to hesitate. Chavez seems to want to return to Chicago, which would be a win for both sides.
Signed with Rangers for two years, $8MM.
45. CC Sabathia – Angels. One year, $8MM. Sabathia is winding down a potential Hall of Fame career and aims to pitch one more season. He’s served the Yankees well for a decade, even as he’s faded into a back-of-the-rotation starter. The 38-year-old lefty could wind up near home on the West Coast if the Yankees move on, and the Angels (where former Yankees exec Billy Eppler is GM) had interest last winter.
Signed with Yankees for one year, $8MM.
46. Adam Jones – Indians. One year, $8MM. Jones, 33, completed his 11th season in the Orioles’ outfield. He’s well beyond his 2012-14 heyday, with his bat dropping to league average and his center field defense drawing extremely poor marks over the past three years. Jones vetoed an August trade to the Phillies, as he did not want to move to right field and play part-time. If playing time is the priority, Jones could look to join the Indians, a contender with plenty of outfield vacancy and previous interest in July.
Signed with Diamondbacks for one year, $3MM.
47. Martin Maldonado – Rockies. Two years, $8MM. Maldonado, 32, spent five years as a part-time catcher in Milwaukee before being traded to the Angels in December 2016. The Halos gave Maldonado regular playing time in 2017, resulting in an American League Gold Glove, but traded him to the Astros at this year’s deadline. With Maldonado, the value is entirely in his defense. He’s one of the game’s better pitch framers and perhaps the very best at throwing out attempted thieves. He should continue to find semi-regular playing time.
Signed with Royals for one year, $2.5MM.
48. Kurt Suzuki – Brewers. Two years, $8MM. Suzuki, 35, has been in a job share with Tyler Flowers on the Braves the last two years. Among catchers with at least 650 plate appearances during that time, Suzuki’s 116 wRC+ is second only to Buster Posey and J.T. Realmuto. Of course, those catchers played much more than Suzuki did. Defensively, Suzuki is a below-average pitch framer and has struggled even more to stop the running game. He’s a bat-first option at catcher — one who can play as many as 100 games if necessary.
Signed with Nationals for two years, $10MM.
49. Ervin Santana – Mariners. One year, $6MM. Santana, 36 in December, has served as a respectable innings eater throughout his 14-year career. He underwent a surgical procedure on his right middle finger in February that wound up ruining his 2018 season. He returned to the Twins for a five-start stint in July and August, but just wasn’t himself with a massive drop in velocity. It’s impossible to guess the state of that finger for Opening Day 2019, but if Santana can get past the injury he could be a bargain buy.
Signed minor league deal with White Sox.
50. Drew Pomeranz – Royals. One year, $6MM. Pomeranz had a fine year in 2016, when he made the All-Star team and authored a 3.32 ERA in 30 starts for the Padres and Red Sox. After the trade, drama developed about the Padres’ disclosure of medical information. In 2017, Pomeranz overcame an early forearm flexor strain to make 32 starts for Boston, again posting a 3.32 ERA. A left forearm flexor strain again surfaced in March of this year, resulting in an April 20th season debut. Pomeranz was knocked around over an eight-start span before hitting the DL for biceps tendinitis. That sidelined him out for the better part of two months, and after he returned he spent most of his time in the bullpen. Pomeranz’s lost season could not have come at a worse time, but on the cusp of his 30th birthday, he’s an intriguing signing if he can stay healthy and recover some of his lost velocity. He’ll probably prioritize a clear path to innings in a big park over signing with a contender.
Signed with Giants for one year, $1.5MM
Honorable mentions:
- Robinson Chirinos – signed with Astros for one year, $5.75MM
- Justin Wilson – signed with Mets for two years, $10MM
- Adrian Beltre – retired
- Asdrubal Cabrera – signed with Rangers for one year, $3.5MM
- Josh Harrison – signed with Tigers for one year, $2MM
- Tyson Ross – signed with Tigers for one year, $5.75MM
- Ryan Madson
- Clay Buchholz – signed with Blue Jays for one year, $3MM
- Jose Iglesias – signed minor league deal with Reds
- Ian Kinsler – signed with Padres for two years, $8MM
- Oliver Perez – signed with Indians for one year, $2.5MM
- Adam Warren – signed with Padres for one year, $2.5MM
- Tony Sipp – signed with Nationals for one year, $1.25MM
Notable deals for unlisted players:
- Michael Fiers – re-signed with Athletics for two years, $14.1MM
We realize that a Top 50 Free Agents list with one set of specific team predictions will leave some fanbases dissatisfied. A few notes on certain clubs:
- Most teams will meet some needs through trades and free agents who fell short of this list.
- The White Sox, Orioles, Pirates, Marlins, and Diamondbacks did not end up with any free agents from this list. Certainly they might be in play on some of the more affordable names, at least, with the Chicago organization perhaps also potentially going after some more premium targets.
- The Yankees have spending capacity well beyond the players we gave them here. They could easily go bigger, and/or take on significant salary in trade.
- For the first time in recent memory, the Rays appear to have decent spending capacity. It’s difficult to ignore precedent and project them to sign a bunch of top free agents, but it is more possible than it had been.
- The Giants are particularly difficult to project, not knowing who their next GM will be.
- The Angels, Nationals, and Cardinals might not have the spending capacity to sign all the players we listed for them, though we think each pick is reasonable on an individual level. In general, teams have ways to clear payroll and we don’t always know when payroll will be increased.
2018-19 MLB Free Agent Tracker
The baseball world is bracing itself for an offseason like no other. The free agent market features a pair of 26-year-old stars: Bryce Harper and Manny Machado. The pair should compete for the largest contract in baseball history. Future Hall of Famer Clayton Kershaw could opt out of his contract, but even if he doesn’t, Patrick Corbin, Dallas Keuchel, Nathan Eovaldi, and other starters make up a solid group. One of the game’s best closers, Craig Kimbrel, is also hitting the open market.
For the best tool to track this winter’s free agent market, bookmark MLBTR’s 2018-19 MLB Free Agent Tracker. This will be updated quickly after any player signs. If you’re wondering who’s available, you can filter by position, handedness, and qualifying offer status. Check out our free agent tracker today!
David Robertson: Why I’m Representing Myself In Free Agency
David Robertson just finished another successful season in the Yankees’ bullpen. That’s been a regular occurrence in his 11-year MLB career, with a stop in Chicago as well. Robertson, 34 in April, owns a 2.88 career ERA and a 12.0 K/9. Several years ago, David and his wife Erin founded High Socks For Hope, a non-profit organization focused on disaster relief as well as helping homeless, disabled or destitute veterans. We urge MLBTR readers to consider a donation.
Earlier this month, MLB.com’s Mark Feinsand reported Robertson was choosing to represent himself in free agency. MLBTR reached out to Robertson and asked for his thought process behind this unique decision. His guest post follows.
At this point in my life and career, no one else understands my wants and needs more than myself. After recognizing this, I made the decision to forgo using an agent since I no longer feel as though I need a middle man. I know what I want in a contract, I’m aware of what I can offer to teams, and teams are aware of my abilities.
I’m sure there is a lot of speculation regarding my choice. One thing I want to address is that this decision has nothing to do with my former agent. He is a great guy and has become a close friend of mine. He did a great job representing me for over a decade and I will always appreciate that. But I believe all players need to pay close attention to what they do and their own career path. I wouldn’t recommend self representation to just anyone – heck I wouldn’t recommend it to the majority of players. However, being a guy that’s hung around long enough to know what I can offer a team and what I would like in return, I feel I’m best suited to have all the discussions necessary to figure out my next contract.
A lot of people have and will question my decision. It’s not common to see a player take this path and I’m aware of that and the potential obstacles I may face by doing so. But in the end, I made this decision for myself and my family and for now I’m going to stick with it. I believe I have a lot to offer a team on and off the field and I know I will end up in the right place.
Free Thursday Night Football Contest On DraftKings
MLBTR is proud to present a free NFL Thursday Night Showdown contest, thanks to our partnership with DraftKings. $10,000 in total prizes will be awarded, with over 205 places getting a share of the winnings. Enter this free contest now! Entries are accepted until 8:20pm ET on Thursday, October 25th.
This is a sponsored post from DraftKings.
Offseason Outlook: Chicago Cubs
MLBTR is publishing Offseason Outlooks for all 30 teams. Click here to read the other entries in this series.
For the first time in franchise history, the Cubs reached the playoffs in four consecutive years. However, a loss to the Rockies in the Wild Card game left a bitter taste in the Cubs’ mouths and the front office must make significant additions to the offense and bullpen.
Guaranteed Contracts
- Jason Heyward, OF: $106MM through 2023 (may opt out of contract)
- Jon Lester, SP: $47.5MM through 2020. Includes mutual/vesting option for 2021.
- Yu Darvish, SP: $101MM through 2023
- Ben Zobrist, INF/OF: $12MM through 2019
- Tyler Chatwood, SP/RP: $25.5MM through 2020
- Brandon Morrow,RP: $12MM through 2019. Includes vesting option for 2020.
- Anthony Rizzo, 1B: $13MM through 2019. Includes club options for 2020 and ’21.
- Steve Cishek, RP: $7.5MM through 2019
- Brian Duensing, RP: $3.5MM through 2019
- Drew Smyly, SP: $7MM through 2019
Arbitration-Eligible Players (projections via MLBTR contributor Matt Swartz)
- Kris Bryant, 3B – $12.4MM
- Kyle Hendricks, SP – $7.6MM
- Javier Baez, INF – $7.1MM
- Addison Russell, SS – $4.3MM
- Kyle Schwarber, OF – $3.1MM
- Mike Montgomery, SP/RP – $3.0MM
- Carl Edwards Jr., RP – $1.4MM
- Tommy La Stella, INF – $1.2MM
Contract Options
- Cole Hamels, SP: $20MM club option. Rangers pay $6MM buyout if declined.
- Jose Quintana, SP: $10.5MM club option with a $1MM buyout
- Pedro Strop, RP: $6.25MM club option with a $500K buyout
- Brandon Kintzler, RP: $10MM club option or $5MM player option
Free Agents
[Chicago Cubs Depth Chart; Chicago Cubs Payroll Overview]
“Our offense broke somewhere along the lines,” stated Cubs president Theo Epstein the day after his team was bounced from the playoffs following a five-hour slog against the Rockies. The Cubs didn’t even expect to be in that Wild Card game, but they lost a tiebreaker game to a surging Brewers club. Before we attempt to guess at how Epstein might go about fixing the offense, let’s take a look at which players are locked in.
Willson Contreras will continue to handle primary catching duties. Contreras, 27 in May, had an argument to be considered the best-hitting catcher in baseball over the period stretching from his June 2016 debut until this year’s trade deadline. Then, from August 2nd onward, he hit .169/.263/.232 with one home run in 160 plate appearances. He went from regularly serving as the Cubs’ #4 or 5 hitter to hitting seventh or eighth most days. Contreras’ collapse is one damning data point for now-former Cubs hitting coach Chili Davis. Getting Contreras back to his established 120 wRC+ level would be a big boost to the 2019 offense. Contreras caught a career-high 1109 2/3 innings in 2018 and would likely benefit from a quality veteran backup. After a strong season in which he made 83 starts for the Braves, free agent Kurt Suzuki might not accept a diminished role, but he’s the type of player the Cubs should target.
The team’s other big in-house offensive project is getting Kris Bryant right. Bryant, 27 in January, had his first real setback as a pro player this year but still managed a 125 wRC+. That’s disappointing only because he’d set his level at 144 over his first three Major League seasons, winning the NL MVP in 2016. Bryant injured his left shoulder on a headfirst slide in late May and was never the same since. He was limited to just 102 games this year. Fortunately, Epstein does not expect surgery for Bryant, and in fact expects a “monster” 2019 out of him. Given Bryant’s stature and potential, I wonder if manager Joe Maddon would be better served locking him in at third base, rather than sprinkling in time at the outfield corners as he has done to date. Healthy, bounceback seasons from Bryant and Contreras are crucial to the Cubs’ 2019 offense.
Anthony Rizzo is the Cubs’ rock at first base and remains among the best hitters in the game at his position. Ben Zobrist bounced back to show he’s actually not done as a hitter at age 37, and he’s an option for slightly less than full-time duty at some combination of second base and the outfield corners again. Javier Baez catapulted himself into the NL MVP discussion with a five-win age-25 season. Baez fits well at any infield position. He maxed out his offensive abilities in 2018 by mashing 83 extra-base hits, making up for his perennially low walk rate. The Cubs are also locked into near-regular playing time for Jason Heyward, because of his strong outfield defense as well as the large amount of money left on his contract. Heyward continued to improve as a hitter in his third year as a Cub, but that still resulted in a low-power league average batting line. The positional flexibility of Heyward, Baez, Zobrist, and others will allow the Cubs to explore both of the major prizes of the 2018-19 free agent market.
Those prizes, of course, are superstars Bryce Harper and Manny Machado. Both free agents project to top the current largest contract in baseball history, Giancarlo Stanton‘s $325MM deal. MLBTR expects each player to reach $400MM, with an average annual value in the range of $30MM. Can the Cubs afford to add the largest contract in baseball history to their ledger? With a new TV deal on the horizon after 2019, the answer appears to be yes. Given arbitration raises, the Cubs will come in around last year’s Opening Day payroll before any new players are added, so I do expect the club to jump past $200MM for the first time. The Cubs successfully reset with a payroll under the Competitive Balance Tax threshold in 2018, reducing the tax penalty for ’19 if they exceed the new $206MM threshold. Last March, I debated the true necessity of teams like the Cubs, Dodgers, and Yankees to reset, but all three have done it and enter the 2018-19 offseason ready to spend.
Epstein has gone big game hunting many times for both the Cubs and Red Sox, and figures to be firmly in the mix for Harper or Machado. Which player is the better fit? My vote is for Harper, who has a higher offensive ceiling than Machado and as a left-handed batter breaks up the Cubs’ core of right-handed hitters (Bryant, Baez, and Contreras). Cubs fans can salivate at the prospect of a Murderer’s Row of Bryant, Harper, Baez, Rizzo, and Contreras. Harper would take over as the team’s regular right fielder, pushing Heyward to center and possibly a young outfielder off the roster, which we’ll discuss later.
The possibility the Cubs prefer Machado should not be discounted. Fans can also dream on a Machado-Baez middle infield combination, although Baez may actually be the superior shortstop. Signing Machado seems to create an inefficiency – pushing Baez back to second, or pushing Bryant to left field. That is, unless Machado is willing to sign under the same conditions most current Cubs position players have, where all but Rizzo, Contreras, and Albert Almora bounce around to multiple positions. I think the Cubs are better-served with Harper in right field and a Heyward-Almora platoon in center.
Almora might be wasted on the short side of a platoon, however, and the Cubs will likely consider trading him under certain scenarios. Likewise, Kyle Schwarber and Ian Happ face the possibility of a trade, particularly if the Cubs acquire a starting outfielder. Schwarber, 26 in March, quieted the talk of his left field defense as a liability. However, he proved powerless against left-handed pitching and was limited to seeing southpaws only 18% of the time under Maddon. There could be another gear for Schwarber if he starts hitting lefties, but as always, Maddon is reluctant to give him that full opportunity on a contending club.
Happ, a 24-year-old switch-hitter, played all three outfield positions and third base this year. Strikeouts were up and power was down in his sophomore season, and he too was unable to hit lefties. Though he’s technically more versatile than Schwarber, Happ seems position-less. He spent more time in center field than any other position (403 2/3 innings) despite being the team’s third-best center fielder. The Cubs limited his time in the infield this year. Schwarber is arbitration eligible for the first time this winter and is controlled for three more seasons; Happ remains near the league minimum and is controlled for five more seasons. It’s simpler retaining Schwarber: keep him in left field, try to unlock his power against left-handed pitching, and he might yet become a middle of the order hitter. Trading Happ is risky, though, given the five remaining years of team control.
Harper and Machado are certainly not the Cubs’ only options for outside additions. They’re just the best ones. Free agent bats like Nelson Cruz, Andrew McCutchen, A.J. Pollock, Michael Brantley, Jed Lowrie, Wilson Ramos, and Yasmani Grandal don’t clearly make the Cubs better or fit onto their roster. The trade market doesn’t appear to boast a superstar, either, unless you think the Cubs could pry Nolan Arenado loose from the Rockies for his final year before free agency.
Cubs shortstop Addison Russell received a 40-game suspension for violating MLB’s domestic violence policy based on claims from his ex-wife, and he will be ineligible to play until May 3rd next year. Asked if Russell will return to the Cubs next year, Epstein replied, “I don’t know. With all of our words and actions going forward, whether we know it or not, we’re sending messages to our fans.” The Cubs don’t have the moral high ground when it comes to domestic violence, having traded for Aroldis Chapman in 2016 about ten months after that pitcher’s incident. In this case, which unlike that one is post-“Me Too,” the PR move probably coincides with the baseball move, and most expect the Cubs to let Russell go. We’ll likely learn next month whether Russell is too toxic to trade to another team, but I would guess not.
Moving on, let’s discuss the Cubs’ starting rotation. Lester, Hendricks, and Quintana are locked in. Yu Darvish’s first year was a disaster, with the pitcher making only eight MLB starts due to a parainfluenza virus, triceps tendinitis/inflammation, a shoulder impingement, and a stress reaction in his elbow. He had seemingly minor elbow surgery in September and is expected to be ready for Spring Training. Given his salary and past success, Darvish will have a spot in the Cubs’ rotation whenever he’s ready. The Cubs also have Drew Smyly under contract. Smyly, a 29-year-old southpaw, underwent Tommy John surgery in July 2017 and signed a two-year deal with the Cubs last December. He’ll be 18 months removed from the procedure when pitchers and catchers report in February and could be an asset given his past success with the Tigers and Rays.
While the Cubs will be cautiously optimistic on Darvish and Smyly for 2019, there is no such optimism for Tyler Chatwood. The Cubs gave Chatwood a three-year, $38MM deal last December based mostly on upside, and the righty’s already-poor control became the worst in baseball in 2018. In fact, Chatwood’s 19.6% walk rate was the fifth-worst in baseball history for pitchers with at least 100 innings. The Cubs’ 2018 season served as a reminder how much every win counts, and I can’t see how Chatwood would have a role on the 2019 Cubs. Russell Martin could make for an excellent bad contract swap from the Cubs’ side, though not so much from Toronto’s. Alex Gordon, Zack Cozart, Homer Bailey, and Martin Prado could be other potential targets in my estimation.
Though the Cubs also have Mike Montgomery as a back-end rotation depth option, there’s more than enough uncertainty to justify picking up Cole Hamels’ $20MM option. Hamels, 35 in December, was excellent in a dozen starts for the Cubs after a July trade from Texas. The Cubs could also attempt to negotiate a two-year deal with Hamels at a lower average annual value.
Aside from the offense, the Cubs’ other big problem is a lack of bullpen depth. In a world where teams are giving half their innings to relievers in the playoffs, the Cubs would have had a difficult time making a sustained postseason run even if they had beaten the Rockies. Brandon Morrow’s season ended on July 15th due to biceps inflammation, even though the injury was initially thought to be on the minor side. Given the 34-year-old’s extensive injury history, this couldn’t have been a shock for the Cubs. Morrow was excellent when he was healthy, and he’ll be delicately deployed in the late innings in 2019. The Cubs have Steve Cishek under contract and will pick up their option on Pedro Strop, making for a decent right-handed trio. Beyond that, I expect multiple external additions and a good amount of turnover. The Cubs do control Montgomery, Carl Edwards Jr., and Randy Rosario. They have Duensing under contract after a terrible year, and should expect Brandon Kintzler to pick up his $5MM player option after his rough stint on the North Side.
Edwards is a tantalizing, frustrating talent, and the Cubs have to wonder whether he’ll ever be a reliable late inning option for them. From the left side, the Cubs can do better than Montgomery, Rosario, and Duensing. The club will have to be prepared to release Duensing and/or Kintzler if those veterans fail to impress in Spring Training. Bottom line: it’s time to turn over at least half the bullpen. I don’t expect the Cubs to make a run at Craig Kimbrel, but the free agent market still offers a long list of options, including Adam Ottavino, Jeurys Familia, David Robertson, Andrew Miller, Joakim Soria, Cody Allen, Zach Britton, and a pair of rehabbing former closers (Kelvin Herrera & Trevor Rosenthal). One veteran worth retaining is Jesse Chavez, who ascended to the top of the Cubs’ decimated bullpen by year’s end and reportedly wants to return.
The Cubs also have a bit of managerial drama, with Joe Maddon entering lame duck status in 2019. Epstein said all the right things about Maddon after the season, but there’s still a feeling that Maddon’s tenure in Chicago is nearing an end. My guess is that short of a 2019 World Championship, Maddon departs after the season.
Though most MLBTR readers graded the Cubs’ 2017-18 offseason an A or a B at the time, the first year results of those deals were quite poor. The stakes might be higher this time around. Now that expectations are sky-high, this year’s early playoff exit must be considered a disappointment. The money involved could be bigger than ever and Epstein will be making decisions that have a large impact on whether his team can pull off another World Championship inside the three years of control remaining for Bryant, Rizzo, and Baez.
Projected Arbitration Salaries For 2019
As explained here, Matt Swartz and MLB Trade Rumors have developed an accurate model to project arbitration salaries. This is the eighth year we’ve done these projections, and I’m proud to present the results for 2019. Official service time is in parentheses next to each player. The Super Two cutoff has been announced as 2.134.
Angels (8)
- Tyler Skaggs (4.135) – $3.6MM
- Andrew Heaney (3.150) – $2.8MM
- JC Ramirez (3.139) – $1.9MM
- Luis Garcia (4.006) – $1.7MM
- Cam Bedrosian (3.153) – $1.7MM
- Nick Tropeano (3.068) – $1.6MM
- Hansel Robles (3.119) – $1.4MM
- Tommy La Stella (4.057) – $1.2MM
Astros (10)
- Gerrit Cole (5.111) – $13.1MM
- Roberto Osuna (3.097) – $6.5MM
- Collin McHugh (5.085) – $5.4MM
- Carlos Correa (3.119) – $5.1MM
- Lance McCullers (3.140) – $4.6MM
- Will Harris (5.102) – $3.6MM
- Ryan Pressly (5.039) – $3.1MM
- Brad Peacock (4.165) – $2.9MM
- Jake Marisnick (4.132) – $2.4MM
- Chris Devenski (3.000) – $1.4MM
Athletics (9)
- Khris Davis (5.104) – $18.1MM
- Marcus Semien (4.118) – $6.6MM
- Blake Treinen (4.065) – $5.8MM
- Sean Manaea (2.157) – $3.8MM
- Liam Hendriks (4.164) – $2.1MM – signed for $2.15MM
- Mark Canha (3.092) – $2.1MM
- Ryan Buchter (3.010) – $1.3MM
- Josh Phegley (4.087) – $1.2MM – signed for $1.075MM
- Ryan Dull (2.143) – $900K – signed for $860K
Blue Jays (9)
- Marcus Stroman (4.148) – $7.2MM
- Ken Giles (4.113) – $6.6MM
- Kevin Pillar (4.113) – $5.3MM
- Randal Grichuk (4.033) – $4.8MM
- Aaron Sanchez (4.069) – $3.8MM
- Devon Travis (3.163) – $2.4MM
- Ryan Tepera (3.008) – $1.7MM
- Brandon Drury (2.165) – $1.4MM
- Joe Biagini (2.134) – $1.0MM
Braves (8)
- Kevin Gausman (4.151) – $9.2MM
- Mike Foltynewicz (3.163) – $5.5MM
- Arodys Vizcaino (5.168) – $4.8MM
- Adam Duvall (3.096) – $3.1MM
- Dan Winkler (4.000) – $1.6MM
- Jonny Venters (5.159) – $1.5MM – signed for $2.25MM
- Sam Freeman (4.066) – $1.5MM
- Charlie Culberson (3.084) – $1.4MM
Brewers (10)
- Travis Shaw (3.088) – $5.1MM
- Corey Knebel (3.151) – $4.9MM
- Jimmy Nelson (4.107) – $3.7MM
- Hernan Perez (4.079) – $2.7MM – signed for $2.5MM
- Junior Guerra (2.155) – $2.7MM
- Zach Davies (3.020) – $2.4MM
- Domingo Santana (3.024) – $2.0MM
- Manny Piña (3.046) – $1.8MM
- Erik Kratz (4.156) – $1.7MM – signed for $1.2MM
- Tyler Saladino (3.053) – $1.0MM – signed for $887.5K
Cardinals (4)
- Marcell Ozuna (5.124) – $13.4MM
- Michael Wacha (5.062) – $6.6MM
- Dominic Leone (3.123) – $1.3MM
- Chasen Shreve (3.167) – $1.2MM – signed for $900K
Cubs (7)
- Kris Bryant (3.171) – $12.4MM
- Kyle Hendricks (4.081) – $7.6MM
- Javier Baez (3.089) – $7.1MM
- Addison Russell (3.167) – $4.3MM
- Kyle Schwarber (3.086) – $3.1MM
- Mike Montgomery (3.089) – $3.0MM
- Carl Edwards Jr. (2.134) – $1.4MM
Diamondbacks (11)
- David Peralta (4.120) – $7.7MM
- Robbie Ray (4.007) – $6.1MM
- Taijuan Walker (4.142) – $4.825MM
- Jake Lamb (4.053) – $4.7MM
- Steven Souza Jr. (4.072) – $4.0MM
- Nick Ahmed (4.054) – $3.1MM
- Archie Bradley (3.112) – $2.0MM
- Andrew Chafin (4.020) – $1.8MM
- T.J. McFarland (4.164) – $1.4MM
- Matt Andriese (3.071) – $1.1MM
- John Ryan Murphy (3.043) – $1.1MM
Dodgers (10)
- Joc Pederson (4.028) – $4.3MM
- Enrique Hernandez (4.054) – $3.2MM
- Chris Taylor (3.037) – $3.2MM
- Josh Fields (5.083) – $2.8MM
- Tony Cingrani (5.088) – $2.7MM – signed for $2.65MM
- Corey Seager (3.032) – $2.6MM
- Pedro Baez (4.059) – $1.8MM
- Yimi Garcia (3.149) – $900K
Giants (3)
- Sam Dyson (4.142) – $5.4MM – signed for $5MM
- Joe Panik (4.100) – $4.2MM – signed for $3.8MM
- Will Smith (5.155) – $4.1MM
Indians (7)
- Trevor Bauer (4.158) – $11.6MM
- Francisco Lindor (3.113) – $10.2MM
- Danny Salazar (4.162) – $5.0MM – signed for $4.5MM
- Leonys Martin (5.161) – $2.8MM – signed for $3MM
- Neil Ramirez (4.001) – $1.3MM – signed for $1.0MM
- Cody Anderson (3.017) – $900K
- Nick Goody (2.160) – $700K – signed for $675K
Mariners (1)
- Roenis Elias (3.069) – $1.0MM
Marlins (5)
- J.T. Realmuto (4.038) – $6.1MM
- Dan Straily (4.126) – $4.8MM
- Jose Urena (3.040) – $3.6MM
- Miguel Rojas (4.043) – $2.6MM
- Adam Conley (2.147) – $1.3MM
Mets (7)
- Jacob deGrom (4.139) – $12.9MM
- Noah Syndergaard (3.149) – $5.9MM
- Zack Wheeler (5.098) – $5.3MM
- Michael Conforto (3.043) – $4.4MM
- Travis d’Arnaud (5.044) – $3.7MM
- Steven Matz (3.099) – $3.0MM
- Kevin Plawecki (2.167) – $1.3MM
Nationals (7)
- Anthony Rendon (5.130) – $17.6MM
- Tanner Roark (5.055) – $9.8MM
- Trea Turner (2.135) – $5.3MM
- Michael Taylor (4.010) – $3.2MM
- Kyle Barraclough (3.059) – $1.9MM
- Joe Ross (3.067) – $1.5MM
- Sammy Solis (3.061) – $900K – signed for $850K
Orioles (3)
- Jonathan Villar (4.113) – $4.4MM
- Dylan Bundy (3.026) – $3.0MM
- Mychal Givens (3.069) – $2.0MM
Padres (6)
- Kirby Yates (4.021) – $3.0MM
- Austin Hedges (2.166) – $1.8MM
- Travis Jankowski (2.169) – $1.4MM
- Bryan Mitchell (3.049) – $1.2MM – signed for $900K
- Robbie Erlin (4.078) – $1.1MM
- Greg Garcia (3.083) – $900K – signed for $910K
Phillies (9)
- Cesar Hernandez (4.154) – $8.9MM
- Aaron Nola (3.076) – $6.6MM
- Maikel Franco (3.170) – $5.1MM
- Vince Velasquez (3.086) – $2.6MM
- Hector Neris (3.068) – $2.0MM
- Jose Alvarez (4.035) – $1.7MM
- Jerad Eickhoff (3.045) – $1.7MM
- Aaron Altherr (3.028) – $1.6MM
- Adam Morgan (3.017) – $1.1MM
Pirates (3)
- Corey Dickerson (5.101) – $8.4MM
- Keone Kela (4.000) – $3.2MM
- Michael Feliz (3.026) – $900K – signed for $850K
Rangers (4)
- Nomar Mazara (3.000) – $3.7MM
- Jurickson Profar (4.165) – $3.4MM
- Delino DeShields Jr. (3.116) – $1.9MM
- Alex Claudio (3.114) – $1.3MM
Rays (4)
- Mike Zunino (4.165) – $4.2MM
- Tommy Pham (3.107) – $4.0MM
- Matt Duffy (4.059) – $2.6MM
- Chaz Roe (3.094) – $1.4MM
Red Sox (12)
- Mookie Betts (4.070) – $18.7MM
- Xander Bogaerts (5.042) – $11.9MM
- Jackie Bradley Jr. (4.150) – $7.9MM
- Eduardo Rodriguez (3.130) – $4.8MM
- Brock Holt (5.052) – $3.4MM
- Tyler Thornburg (5.057) – $2.3MM – signed for $1.75MM
- Sandy Leon (4.149) – $2.3MM
- Matt Barnes (3.110) – $1.5MM
- Brandon Workman (4.051) – $1.4MM
- Steven Wright (4.087) – $1.4MM
- Heath Hembree (3.106) – $1.2MM
- Blake Swihart (2.164) – $1.1MM
Reds (5)
- Yasiel Puig (5.102) – $11.3MM
- Scooter Gennett (5.071) – $10.7MM
- Alex Wood (5.123) – $9.0MM
- Jose Peraza (2.141) – $3.6MM
- Anthony Desclafani (4.062) – $2.1MM
- Michael Lorenzen (3.159) – $1.9MM
- Curt Casali (2.151) – $1.3MM
Rockies (8)
- Nolan Arenado (5.155) – $26.1MM
- Trevor Story (3.000) – $6.4MM
- Chad Bettis (4.096) – $3.2MM
- Jon Gray (3.062) – $3.2MM
- Tyler Anderson (3.065) – $2.9MM
- Chris Rusin (4.092) – $1.7MM – signed for $1.6875MM
- Scott Oberg (3.063) – $1.2MM
- Tony Wolters (2.161) – $1.1MM
Royals (3)
- Jesse Hahn (3.067) – $1.7MM – signed for $800K
- Cheslor Cuthbert (3.030) – $1.1MM – signed for $850K
- Brian Flynn (3.086) – $1.0MM – signed for $800K
Tigers (6)
- Nicholas Castellanos (5.029) – $11.3MM
- Shane Greene (4.075) – $4.8MM
- Michael Fulmer (2.157) – $3.0MM
- Matthew Boyd (2.136) – $3.0MM
- Daniel Norris (3.073) -$1.4MM
- Blaine Hardy (3.108) – $1.2MM
Twins (10)
- Jake Odorizzi (5.042) – $9.4MM
- Kyle Gibson (5.039) – $7.9MM
- C.J. Cron (4.097) – $5.2MM – signed for $4.8MM
- Eddie Rosario (3.120) – $5.0MM
- Max Kepler (2.152) – $3.2MM
- Miguel Sano (3.066) – $3.1MM
- Ehire Adrianza (4.131) – $1.8MM – signed for $1.3MM
- Taylor Rogers (2.145) – $1.6MM
- Byron Buxton (2.160) – $1.2MM
- Trevor May (4.012) – $1.1MM
White Sox (5)
- Jose Abreu (5.000) – $16MM
- Alex Colome (4.118) – $7.3MM
- Yolmer Sanchez (3.134) – $4.7MM
- Carlos Rodon (3.168) – $3.7MM
- Leury Garcia (4.025) – $1.9MM – signed for $1.55MM
Yankees (9)
- Didi Gregorius (5.159) – $12.4MM
- Sonny Gray (5.061) – $9.1MM
- Dellin Betances (5.078) – $6.4MM
- Aaron Hicks (5.041) – $6.2MM
- James Paxton (4.151) – $9.0MM
- Luis Severino (2.170) – $5.1MM
- Austin Romine (5.045) – $2.0MM
- Tommy Kahnle (3.131) – $1.5MM
- Greg Bird (3.053) – $1.5MM