
Projected Arbitration Salaries For 2026
Matt Swartz has created a model to project salaries for arbitration eligible players, which we’ve been publishing at MLB Trade Rumors for 15 years.
In the baseball industry, teams and agents determine arbitration salaries by identifying comparable players. To project the entire arbitration class in this way would take a massive amount of time and effort. So, Matt has developed an algorithm to project arbitration salaries that looks at the player’s playing time, position, role, and performance statistics while accounting for inflation. The performance of comparable players matters, but our system is not directly selecting individual comps for each individual player.
As a disclaimer, it should be emphasized that our projections are not to be used as a scorecard for the agent and team on an individual player level. A player doing better or worse than our projection isn’t indicative of anything. Our arbitration projections are created as a tool for our readers to get a general idea of a team’s payroll situation.
While the service time figures included are official, there is not yet an established Super Two cutoff, which delineates which players with between two and three years of service qualify for early arbitration. That could lead to a few late entrants being added to the list. It’s also worth noting that contracts signed prior to the non-tender deadline aren’t generally considered to be normal arbitration comparables; contracts signed prior to that deadline can be skewed by light offers that are presented to borderline non-tender candidates in take-it-or-leave-it fashion (with “leave it,” in such instances, being a non-tender). That’s not universal to all pre-tender deals but is frequently applicable.
One other note: it’s increasingly common for teams to negotiate one-year deals with club options or mutual options covering an additional arbitration season. We’ve noted all of the players who have an option for the 2025 season under the terms of a prior agreement. If the team buys out that option, the player does not become a free agent. He simply is paid whatever buyout (if any) was agreed upon under the terms of the prior agreement and heads back through the arbitration process again this winter.
If you find MLBTR’s arbitration projections useful, please consider supporting us with a subscription. Trade Rumors Front Office subscribers received early access to these arbitration projections, and the subscription also includes the best research tools you can get without actually working for an MLB team: our contract tracker, our agency database and our GM tracker.
The projections:
Angels (10)
- Taylor Ward (5.164): $13.7MM
- Brock Burke (5.045): $2MM
- Connor Brogdon (4.090): $1MM
- Jo Adell (4.085): $5.5MM
- Carson Fulmer (4.018): $1.2MM
- Reid Detmers (3.159): $2.6MM
- Jose Soriano (3.121): $3.2MM
- Carter Kieboom (3.009): $800K
- Logan O’Hoppe (3.008): $2.9MM
- Zach Neto (2.170): $4.1MM
Astros (16)
- Mauricio Dubon (5.162): $5.8MM
- Steven Okert (5.089): $2MM
- Luis Garcia (5.083): $2.2MM
- Ramon Urias (5.025): $4.4MM
- Bryan Abreu (5.022): $5.9MM
- Enyel De Los Santos (5.015): $2.1MM
- Chas McCormick (4.161): $3.4MM
- Isaac Paredes (4.160): $9.3MM
- Jesus Sanchez (4.118): $6.5MM
- Jake Meyers (4.044): $3.5MM
- Jeremy Pena (4.000): $7.9MM
- Hunter Brown (3.035): $5.7MM
- Yainer Diaz (3.035): $4.5MM
- Hayden Wesneski (2.170): $1.5MM
- Bennett Sousa (2.156): $1.1MM
- Taylor Trammell (2.144): $900K
Athletics (5)
- Austin Wynns (5.017): $1.8MM
- Shea Langeliers (3.051): $5.1MM
- JJ Bleday (3.029): $2.2MM
- Ken Waldichuk (2.150): $900K
- Luis Medina (2.149): $900K
Blue Jays (7)
- Daulton Varsho (5.128): $9.7MM
- Eric Lauer (5.091): $4.4MM
- Dillon Tate (5.018): $1.7MM
- Nick Sandlin (4.157): $2MM
- Ernie Clement (3.168): $4.3MM
- Ryan Burr (3.109): $800K
- Tyler Heineman (3.066): $1MM
Braves (9)
- Jake Fraley (5.097): $3.6MM
- Joel Payamps (4.117): $3.4MM
- Jose Suarez (4.064): $1.5MM
- Alek Manoah (4.063): $2.2MM
- Dylan Lee (3.150): $1.9MM
- Eli White (3.140): $1.2MM
- Vidal Brujan (3.014): $800K
- Joey Wentz (2.166): $1.1MM
- Nick Allen (2.164): $1.5MM
Brewers (7)
- Jake Bauers (5.084): $2MM
- Andrew Vaughn (4.142): $7.8MM
- William Contreras (4.112): $11.1MM (Brewers hold a $12MM club option with a $100K buyout)
- Nick Mears (4.022): $1.6MM
- Trevor Megill (4.002): $4.2MM
- Garrett Mitchell (3.040): $1MM
- Brice Turang (2.165): $4.4MM
Cardinals (9)
- Jorge Alcala (5.165): $2.1MM
- JoJo Romero (5.045): $4.4MM
- John King (4.148): $2.1MM
- Lars Nootbaar (4.076): $5.7MM
- Brendan Donovan (4.000): $5.4MM
- Andre Pallante (3.145): $3.4MM
- Nolan Gorman (3.114): $2.9MM
- Alec Burleson (3.029): $3.5MM
- Matthew Liberatore (2.144): $2.8MM
Cubs (4)
- Reese McGuire (5.110): $1.9MM
- Justin Steele (4.143): $6.55MM
- Eli Morgan (4.091): $1.1MM
- Javier Assad (3.027): $1.9MM
Diamondbacks (11)
- Ildemaro Vargas (5.129): $1.4MM
- A.J. Puk (5.124): $3.3MM
- Ryan Thompson (5.095): $3.9MM
- Kevin Ginkel (5.033): $3MM
- John Curtiss (4.078): $1.2MM
- Pavin Smith (4.015): $2.4MM
- Alek Thomas (3.103): $2.2MM
- Kyle Nelson (3.081): $1MM
- Jake McCarthy (3.074): $1.9MM
- Gabriel Moreno (3.061): $2.4MM
- Ryne Nelson (3.020): $3.3MM
Dodgers (9)
- Brusdar Graterol (5.167): $2.8MM
- Tony Gonsolin (5.152): $5.4MM
- Evan Phillips (5.136): $6.1MM
- Alex Vesia (5.078): $4.1MM (Dodgers hold a $3.65MM club option with a $50K buyout)
- Anthony Banda (4.135): $1.7MM
- Brock Stewart (4.093): $1.4MM
- Ben Rortvedt (3.135): $1.3MM
- Michael Grove (3.031): $800K
- Alex Call (2.161): $1.5MM
Giants (5)
- JT Brubaker (5.162): $2.1MM
- Andrew Knizner (5.090): $1.3MM
- Joey Lucchesi (5.047): $2MM
- Ryan Walker (2.136): $2.5MM
- Patrick Bailey (2.136): $2.2MM
Guardians (8)
- Kolby Allard (5.004): $1.9MM
- Sam Hentges (4.157): $1.3375MM
- Steven Kwan (4.000): $8.8MM
- Ben Lively (3.133): $2.7MM
- Nolan Jones (3.007): $2MM
- Will Brennan (2.155): $900K
- David Fry (2.154): $1.2MM
- Matt Festa (2.153): $1MM
Marlins (7)
- Anthony Bender (4.153): $2.3MM
- Braxton Garrett (3.168): $1.53MM
- Edward Cabrera (3.147): $3.7MM
- Ryan Weathers (3.066): $1.5MM
- Andrew Nardi (3.053): $800K
- Max Meyer (2.166): $1.3MM
- Calvin Faucher (2.156): $1.9MM
Mariners (10)
- Trent Thornton (5.148): $2.5MM
- Randy Arozarena (5.129): $18.2MM
- Logan Gilbert (4.144): $10MM
- Gabe Speier (4.000): $1.7MM
- George Kirby (3.151): $5.4MM
- Tayler Saucedo (3.146): $1.1MM
- Matt Brash (3.121): $1.8MM
- Luke Raley (3.106): $1.8MM
- Gregory Santos (3.055): $800K
- Bryce Miller (2.153): $2.4MM
- Jackson Kowar (2.139): $800K
Mets (9)
- Luis Torrens (5.105): $2.2MM
- Tyrone Taylor (5.093): $3.6MM
- David Peterson (5.089): $7.6MM
- Nick Madrigal (5.087): $1.35MM
- Tylor Megill (4.031): $2.6MM
- Max Kranick (3.011): $1MM
- Huascar Brazoban (2.170): $1.3MM
- Francisco Alvarez (2.164): $2.4MM
- Reed Garrett (2.143): $1.4MM
Nationals (9)
- Jorge Alfaro (5.160): $1MM
- Luis Garcia Jr. (4.142): $7MM
- Josiah Gray (4.075): $1.35MM
- Mason Thompson (4.022): $1MM
- MacKenzie Gore (4.000): $4.7MM
- Riley Adams (3.171): $1.5MM
- CJ Abrams (3.130): $5.6MM
- Jake Irvin (2.152): $3.3MM
- Cade Cavalli (2.141): $1.3MM
Orioles (14)
- Ryan Mountcastle (5.105): $7.8MM
- Keegan Akin (5.083): $3MM
- Dylan Carlson (5.067): $1.5MM
- Trevor Rogers (5.047): $6MM
- Tyler Wells (4.132): $2.7MM
- Jose Castillo (4.112): $1.7MM
- Dean Kremer (4.112): $5.1MM
- Adley Rutschman (4.000): $6.8MM
- Felix Bautista (4.000): $2.1MM
- Kyle Bradish (3.160): $2.8MM
- Yennier Cano (3.065): $1.8MM
- Gunnar Henderson (3.036): $6.6MM
- Alex Jackson (3.036): $1.8MM
- Albert Suarez (3.019): $900K
Padres (7)
- Adrian Morejon (5.140): $3.6MM
- Jason Adam (5.132): $6.8MM
- Gavin Sheets (4.076): $4.3MM
- JP Sears (3.065): $3.5MM
- Luis Campusano (3.003): $1MM
- Mason Miller (2.166): $3.4MM
- Freddy Fermin (2.165: $1.8MM
Phillies (9)
- Jesus Luzardo (5.165): $10.4MM
- Edmundo Sosa (5.140): $3.9MM
- Alec Bohm (5.106): $10.3MM
- Garrett Stubbs (4.148): $925K
- Brandon Marsh (4.078): $4.5MM
- Jhoan Duran (4.000): $7.6MM
- Bryson Stott (4.000): $5.8MM
- Tanner Banks (3.092): $1.2MM
- Rafael Marchan (3.006): $1MM
Pirates (9)
- Dennis Santana (5.126): $3.4MM
- Johan Oviedo (4.078): $2MM
- Joey Bart (4.020): $2.7MM
- Justin Lawrence (3.167): $1.2MM
- Yohan Ramirez (3.135): $1.2MM
- Colin Holderman (3.120): $1.7MM
- Oneil Cruz (3.110): $3.6MM
- Dauri Moreta (3.056): $800K
- Jack Suwinski (2.170): $1.7MM
Rangers (9)
- Jonah Heim (5.097): $6MM
- Adolis Garcia (5.095): $12.1MM
- Josh Sborz (5.055): $1.1MM
- Jacob Webb (5.046): $2MM
- Sam Haggerty (5.007): $1.4MM
- Josh Smith (3.129): $3MM
- Jake Burger (3.127): $3.5MM
- Ezequiel Duran (3.050): $1.4MM
- Josh Jung (3.023): $2.9MM
Rays (17)
- Shane McClanahan (4.158): $3.6MM
- Cole Sulser (4.096): $1.2MM
- Taylor Walls (4.092): $2MM (Rays hold a $2.45MM club option with a $50K buyout)
- Griffin Jax (4.091): $3.6MM
- Garrett Cleavinger (4.060): $2.1MM
- Shane Baz (3.158): $3.1MM
- Nick Fortes (3.149): $2.4MM
- Christopher Morel (3.117): $2.6MM
- Stuart Fairchild (3.114): $900K
- Josh Lowe (3.093): $2.9MM
- Bryan Baker (3.049): $1.5MM
- Ryan Pepiot (3.005): $3.7MM
- Alex Faedo (2.169): $800K
- Kevin Kelly (2.156): $1MM
- Richie Palacios (2.156): $1MM
- Edwin Uceta (2.150): $1.4MM
- Manuel Rodriguez (2.139): $1.2MM
Red Sox (9)
- Nathaniel Lowe (5.145): $13.5MM
- Tanner Houck (4.100): $3.95MM
- Jarren Duran (3.155): $8.4MM (Red Sox hold an $8MM club option with a $100K buyout)
- Kutter Crawford (3.136): $2.75MM
- Romy Gonzalez (3.083): $1.8MM
- Connor Wong (3.079): $1.6MM
- Triston Casas (3.032): $1.7MM
- Josh Winckowski: (3.003): $800K
- Brennan Bernardino (2.150): $1.1MM
Reds (14)
- Brady Singer (5.156): $11.9MM
- Santiago Espinal (5.149): $2.9MM
- Gavin Lux (5.114): $5MM
- Tyler Stephenson (5.056): $6.4MM
- Ian Gibaut (4.077): $1.5MM
- Sam Moll (4.023): $1.2MM
- Nick Lodolo (4.000): $4.3MM
- Graham Ashcraft (3.130): $1.4MM
- TJ Friedl (3.112): $4.9MM
- Tony Santillan (3.099): $2.4MM
- Spencer Steer (3.035): $4.5MM
- Will Benson (3.003): $1.7MM
- Matt McLain (2.140): $2.6MM
- Brandon Williamson (2.139): $800K
Rockies (7)
- Thairo Estrada (5.153): $3.8MM (Estrada’s contract contains a $7MM mutual option with a $750K buyout)
- Jimmy Herget (4.069): $1.5MM
- Mickey Moniak (4.027): $4.2MM
- Lucas Gilbreath (3.150): $900K
- Ryan Feltner (3.071): $2.3MM
- Tyler Freeman (3.046): $1.8MM
- Brenton Doyle (2.161): $3.2MM
Royals (16)
- Taylor Clarke (5.148): $1.9MM
- Kris Bubic (5.135): $6MM
- John Schreiber (5.027): $3.8MM
- Jonathan India (5.000): $7.4MM
- Kyle Wright (4.151): $1.8MM
- Kyle Isbel (4.043): $2.7MM
- Bailey Falter (3.138): $3.3MM
- Daniel Lynch IV (3.136): $1.3MM
- Sam Long (3.121): $950K
- Vinnie Pasquantino (3.101): $5.4MM
- Angel Zerpa (3.082): $1.2MM
- Michael Massey (3.068): $2MM
- MJ Melendez (3.016): $2.65MM
- Maikel Garcia (2.168): $4.8MM
- James McArthur (2.150): $800K
- Lucas Erceg (2.136): $1.9MM
Tigers (15)
- Tanner Rainey (5.167): $1.6MM
- Tarik Skubal (5.114): $17.8MM
- Casey Mize (5.111): $5.4MM
- Jake Rogers (5.040): $2.9MM
- Will Vest (4.100): $3.3MM
- Zach McKinstry (4.099): $3.5MM
- Matt Vierling (4.026): $3.1MM
- Jason Foley (3.150): $3.15MM
- Alex Lange (3.145): $900K
- Andy Ibanez (3.133): $1.8MM
- Riley Greene (3.110): $6.6MM
- Spencer Torkelson (3.076): $5.1MM
- Kerry Carpenter (3.057): $3.5MM
- Beau Brieske (3.056): $1.3MM
- Tyler Holton (3.047): $1.7MM
Twins (10)
- Genesis Cabrera (5.149): $1.4MM
- Ryan Jeffers (5.089): $6.6MM
- Justin Topa (5.044): $1.7MM (Twins hold a $2MM club option with a $225K buyout)
- Michael Tonkin (5.044): $1.4MM
- Bailey Ober (4.093): $4.6MM
- Joe Ryan (4.033): $5.8MM
- Trevor Larnach (4.014): $4.7MM
- Royce Lewis (3.142): $3MM
- Anthony Misiewicz (3.082): $1.1MM
- Cole Sands (3.017): $1.3MM
White Sox (3)
- Mike Tauchman (5.143): $3.4MM
- Steven Wilson (3.166): $1.5MM
- Derek Hill (3.040): $1MM
Yankees (14)
- Jazz Chisholm Jr. (5.075): $10.2MM
- David Bednar (5.073): $9MM
- Mark Leiter Jr. (5.031): $3MM
- Clarke Schmidt (4.148): $4.9MM
- Camilo Doval (4.071): $6.6MM
- Jake Cousins (3.091): $841K
- Ian Hamilton (3.081): $941K
- Luis Gil (3.073): $2.1MM
- Scott Effross (3.063): $800K
- Jake Bird (3.051): $1MM
- Oswaldo Cabrera (3.050): $1.2MM
- Fernando Cruz (3.035): $1.3MM
- Anthony Volpe (3.000): $3.9MM
- Jose Caballero (2.170): $1.9MM
Projected Arbitration Salaries For 2025
Matt Swartz has created a model to project salaries for arbitration eligible players, which we’ve been publishing at MLB Trade Rumors for 14 years.
In the baseball industry, teams and agents determine arbitration salaries by identifying comparable players. To project the entire arbitration class in this way would take a massive amount of time and effort. So, Matt has developed an algorithm to project arbitration salaries that looks at the player’s playing time, position, role, and performance statistics while accounting for inflation. The performance of comparable players matters, but our system is not directly selecting individual comps for each individual player.
As a disclaimer, it should be emphasized that our projections are not to be used as a scorecard for the agent and team on an individual player level. A player doing better or worse than our projection isn’t indicative of anything. Our arbitration projections are created as a tool for our readers to get a general idea of a team’s payroll situation.
The service time figures included are not official. Also, there is not yet an established Super Two cutoff, which delineates which players with between two and three years of service qualify for early arbitration. That could lead to a few late entrants being added to the list. It’s also worth noting that contracts signed prior to the non-tender deadline aren’t generally considered to be normal arbitration comparables; contracts signed prior to that deadline can be skewed by light offers that are presented to borderline non-tender candidates in take-it-or-leave-it fashion (with “leave it,” in such instances, being a non-tender). That’s not universal to all pre-tender deals but is frequently applicable.
One other note: it’s increasingly common for teams to negotiate one-year deals with club options or mutual options covering an additional arbitration season. We’ve noted all of the players who have an option for the 2025 season under the terms of a prior agreement. If the team buys out that option, the player does not become a free agent. He simply is paid whatever buyout (if any) was agreed upon under the terms of the prior agreement and heads back through the arbitration process again this winter.
If you find MLBTR’s arbitration projections useful, please consider supporting us with a subscription. Trade Rumors Front Office subscribers received early access to these arbitration projections, and the subscription also includes the best research tools you can get without actually working for an MLB team: our contract tracker, and our agency database.
The projections:
Angels (12)
- Griffin Canning (5.075): $5.1MM
- Luis Rengifo (5.043): $5.8MM
- Taylor Ward (4.164): $9.2MM
- Patrick Sandoval (4.149): $5.9MM
- Jose Quijada (4.046): $1.1MM
- Brock Burke (4.045): $1.2MM
- Jose Suarez (4.022): $1.2MM
- Carson Fulmer (3.108): $1MM
- Jo Adell (3.085): $2.1MM
- Matt Thaiss (3.038): $1.3MM
- Mickey Moniak (3.027): $1.8MM
- Reid Detmers (2.159): $1.9MM
Astros (10)
- Framber Valdez (5.163): $17.8MM
- Kyle Tucker (5.079): $15.8MM
- Jose Urquidy (5.049): $3.75MM
- Mauricio Dubon (4.162): $4.6MM
- Luis Garcia (4.083): $1.875MM
- Bryan Abreu (4.022): $3.7MM
- Chas McCormick (4.000): $3.3MM
- Jake Meyers (3.044): $2.2MM
- Jeremy Pena (3.000): $4.4MM
- Penn Murfee (2.169): $800K
Athletics (5)
- Austin Adams (5.150): $1.7MM
- Miguel Andujar (5.053): $2.8MM
- Seth Brown (4.096): $3.8MM
- Brent Rooker (3.059): $5.1MM
- Dany Jimenez (2.162): $1MM
Blue Jays (10)
- Vladimir Guerrero Jr. (5.157): $29.6MM
- Erik Swanson (5.059): $3.2MM
- Jordan Romano (5.051): $7.75MM
- Genesis Cabrera (5.011): $2.5MM
- Dillon Tate (4.144): $1.9MM
- Daulton Varsho (4.128): $7.7MM
- Alejandro Kirk (4.047): $4.1MM
- Alek Manoah (3.063): $2.4MM
- Zach Pop (2.171): $1MM
- Ernie Clement (2.168): $1.7MM
Braves (6)
- Ramon Laureano (5.159): $6.1MM
- Cavan Biggio (5.110): $4.3MM
- Huascar Ynoa (3.117): $825K
- Jarred Kelenic (2.169): $2.3MM
- Dylan Lee (2.150): $1.2MM
- Eli White (2.140): $800K
Brewers (10)
- Hoby Milner (5.068): $2.7MM
- Aaron Civale (5.058): $8MM
- Devin Williams (5.056): $7.7MM (Brewers hold $10.5MM club option/$250K buyout)
- Jake Bauers (4.084): $2.3MM
- Bryse Wilson (4.036): $1.5MM
- Joel Payamps (4.027): $2.8MM
- Eric Haase (3.159): $1.8MM
- William Contreras (3.112): $7.6MM
- Nick Mears (3.022): $900K
- Trevor Megill (3.002): $2MM
Cardinals (6)
- Ryan Helsley (5.105): $6.9MM
- JoJo Romero (4.045): $1.9MM
- John King (3.145): $1.5MM
- Lars Nootbaar (3.076): $2.5MM
- Brendan Donovan (3.000): $3.6MM
- Andre Pallante (2.145): $2.3MM
Cubs (14)
- Yency Almonte (5.143): $2.2MM
- Christian Bethancourt (5.023): $2.5MM
- Mike Tauchman (4.143): $2.9MM
- Julian Merryweather (4.109): $1.3MM
- Nick Madrigal (4.087): $1.9MM
- Patrick Wisdom (4.058): $3MM
- Adbert Alzolay (4.050): $2.3MM
- Trey Wingenter (4.049): $1.4MM
- Nate Pearson (4.005): $1.4MM
- Isaac Paredes (3.160): $6.9MM
- Justin Steele (3.143): $6.4MM
- Jimmy Herget (3.069): $900K
- Colten Brewer (3.063): $800K
- Keegan Thompson (3.006): $1MM
Diamondbacks (8)
- Zac Gallen (5.100): $14.1MM
- A.J. Puk (4.124): $2.6MM
- Ryan Thompson (4.095): $2.9MM
- Kevin Ginkel (4.033): $2.3MM
- Joe Mantiply (4.029): $1.6MM
- Kyle Nelson (3.076): $800K
- Geraldo Perdomo (3.015): $2.1MM
- Pavin Smith (3.015): $1.6MM
Dodgers (9)
- Dustin May (5.059): $2.135MM
- Michael Kopech (5.041): $5.2MM
- Brusdar Graterol (4.167): $2.7MM
- Tony Gonsolin (4.152): $5.4MM
- Evan Phillips (4.136): $6.2MM
- Gavin Lux (4.114): $2.7MM
- Alex Vesia (4.078): $1.9MM
- Connor Brogdon (3.139): $800K
- Anthony Banda (3.135): $1.1MM
Giants (4)
- Mike Yastrzemski (5.128): $9.5MM
- LaMonte Wade Jr. (5.035): $4.7MM
- Tyler Rogers (5.034): $5.5MM
- Camilo Doval (3.071): $4.6MM
Guardians (9)
- Josh Naylor (5.127): $12MM
- Lane Thomas (5.014): $8.3MM
- James Karinchak (4.099): $1.9MM
- Triston McKenzie (4.002): $2.4MM
- Sam Hentges (3.157): $1.4MM
- Nick Sandlin (3.157): $1.6MM
- Eli Morgan (3.091): $1MM
- Steven Kwan (3.000): $4.3MM
- Ben Lively (2.133): $3.2MM
Marlins (6)
- Jesus Luzardo (4.165): $6MM
- Anthony Bender (3.153): $1.4MM
- Jesus Sanchez (3.118): $3.2MM
- Braxton Garrett (2.168): $1.8MM
- Nick Fortes (2.149): $1.6MM
- Edward Cabrera (2.147): $2.2MM
Mariners (12)
- Austin Voth (5.115): $2.2MM
- JT Chargois (5.101): $1.7MM
- Luis Urias (5.014): $5MM
- Trent Thornton (4.148): $2.1MM
- Randy Arozarena (4.129): $11.7MM
- Josh Rojas (4.126): $4.3MM
- Sam Haggerty (4.036): $900K
- Logan Gilbert (3.144): $8.1MM
- Tayler Saucedo (3.112): $1MM
- Cal Raleigh (3.085): $5.6MM
- Gabe Speier (2.172): $900K
- George Kirby (2.151): $5.5MM
Mets (8)
- Joey Lucchesi (5.112): $1.8MM
- Paul Blackburn (5.018): $4.4MM
- Luis Torrens (4.105): $1.1MM
- Tyrone Taylor (4.093): $2.9MM
- David Peterson (4.089): $4.4MM
- Alex Young (4.085): $1.4MM
- DJ Stewart (3.144): $1.7MM
- Sean Reid-Foley (3.133): $900K
- Tylor Megill (3.031): $2.1MM
Nationals (9)
- Tanner Rainey (5.127): $1.9MM
- Derek Law (5.081): $3MM
- Ildemaro Vargas (5.007): $1.8MM
- Kyle Finnegan (5.000): $8.6MM
- Luis Garcia Jr. (3.142): $4.8MM
- Josiah Gray (3.075): $1.4MM
- Mason Thompson (3.046): $800K
- Riley Adams (3.005): $1.1MM
- MacKenzie Gore (3.000): $3.5MM
Orioles (15)
- Gregory Soto (5.102): $5.6MM
- Cedric Mullins (5.078): $8.7MM
- Jorge Mateo (5.000): $3.2MM
- Matt Bowman (4.137): $1.3MM
- Ryan Mountcastle (4.105): $6.6MM
- Cionel Perez (4.085): $2.1MM (Orioles hold $2.2MM club option)
- Keegan Akin (4.083): $1.4MM
- Trevor Rogers (4.075): $2.8MM
- Jacob Webb (4.046): $1.7MM
- Ramon Urias (4.025): $3.1MM
- Tyler Wells (3.132): $2.1MM
- Dean Kremer (3.112): $3.5MM
- Emmanuel Rivera (3.026): $1.4MM
- Adley Rutschman (3.000): $5.8MM
- Kyle Bradish (2.160): $2.1MM
Padres (8)
- Luis Arraez (5.121): $14.6MM
- Dylan Cease (5.089): $13.7MM
- Tyler Wade (5.058): $900K
- Michael King (5.004): $7.9MM
- Adrian Morejon (4.140): $1.8MM
- Jason Adam (4.132): $5.3MM
- Luis Patino (3.061): $800K
- Luis Campusano (2.144): $1.7MM
Phillies (9)
- Ranger Suarez (5.112): $8.9MM
- Austin Hays (5.057): $6.4MM
- Jose Ruiz (4.148): $1.2MM
- Edmundo Sosa (4.140): $2.5MM
- Garrett Stubbs (4.120): $1.2MM
- Alec Bohm (4.106): $8.1MM
- Kolby Allard (4.021): $1.1MM
- Brandon Marsh (3.078): $3MM
- Bryson Stott (3.000): $3.5MM
Pirates (9)
- Dennis Santana (4.126): $1.8MM
- David Bednar (4.076): $6.6MM
- Ben Heller (3.165): $1MM
- Connor Joe (3.136): $3.2MM
- Johan Oviedo (3.079): $1.5MM
- Bryan De La Cruz (3.056): $4MM
- Joey Bart (3.020): $1.8MM
- Colin Holderman (2.144): $1.4MM
- Bailey Falter (2.138): $2.8MM
Rangers (5)
- Nathaniel Lowe (4.145): $10.7MM
- Jonah Heim (4.097): $4.8MM
- Dane Dunning (4.078): $4.4MM
- Josh Sborz (4.055): $1.3MM
- Leody Taveras (3.124): $4.3MM
Rays (12)
- Colin Poche (5.114): $3.4MM
- Zack Littell (5.043): $4.8MM
- Tyler Alexander (5.011): $2.8MM
- Drew Rasmussen (4.111): $2MM
- Dylan Carlson (4.104): $2.7MM
- Cole Sulser (4.031): $1MM
- Taylor Walls (3.092): $1.3MM
- Garrett Cleavinger (3.060): $1.4MM
- Ben Rortvedt (3.043): $1.1MM
- Jose Siri (3.015): $2.3MM
- Richard Lovelady (3.008): $900K
- Shane Baz (2.158): $1.9MM
Red Sox (3)
- Tanner Houck (3.100): $4.5MM
- Jarren Duran (2.155): $4.9MM
- Kutter Crawford (2.136): $3.5MM
Reds (10)
- Ty France (5.089): $8.6MM
- Tejay Antone (5.000): $1.1MM
- Santiago Espinal (4.149): 4MM
- Jake Fraley (4.097): $3.3MM
- Tyler Stephenson (4.056): $5.2MM
- Austin Wynns (4.017): $1.4MM
- Ian Gibaut (3.077): $800K
- Sam Moll (3.075): $1.1MM
- Alexis Diaz (3.000): $4.2MM
- Nick Lodolo (3.000): $2.2MM
Rockies (10)
- Dakota Hudson (5.141): $2.3MM
- Cal Quantrill (5.132): $9MM
- Austin Gomber (5.111): $5.6MM
- Brendan Rodgers (5.075): $5.5MM
- Jake Cave (5.071): $1.8MM
- Peter Lambert (4.083): $1.5MM
- Sam Hilliard (4.023): $1.7MM
- Lucas Gilbreath (3.148): $900K
- Justin Lawrence (2.167): $1MM
- Ryan Feltner (2.143): $2.6MM
Royals (10)
- Josh Taylor (5.121): $1.1MM
- Hunter Harvey (5.047): $3.9MM
- Brady Singer (4.156): $8.8MM
- Kris Bubic (4.135): $2.8MM
- Kyle Wright (4.062): $1.8MM
- John Schreiber (4.027): $2MM
- Carlos Hernandez (3.099): $1.2MM
- Kyle Isbel (3.043): $1.7MM
- MJ Melendez (2.153): $2.5MM
- Daniel Lynch IV (2.136): 1.1MM
Tigers (11)
- Tarik Skubal (4.114): $8MM
- Casey Mize (4.111): $2MM (Tigers hold $3.1MM club option/$10K buyout)
- Jake Rogers (4.040): $2.5MM
- Will Vest (3.100): $1.4MM
- Zach McKinstry (3.099): $1.3MM
- Jason Foley (3.033): $3.5MM
- Matt Vierling (3.026): $3MM
- Akil Baddoo (3.003): $1.6MM
- Alex Lange (3.003): $1.3MM
- Andy Ibanez (2.170): $1.5MM
- Beau Brieske (2.134): $1.3MM
Twins (13)
- Willi Castro (5.017): $6.2MM
- Jorge Alcala (4.165): $1.7MM (Twins hold $1.5MM club option/$55K buyout)
- Ryan Jeffers (4.089): $4.7MM
- Michael Tonkin (4.074): $1.5MM
- Justin Topa (4.044): $1.3MM
- Alex Kirilloff (3.141): $1.8MM
- Bailey Ober (3.093): $4.3MM
- Brock Stewart (3.093): $800K
- Griffin Jax (3.091): $2.6MM
- Joe Ryan (3.033): $3.8MM
- Trevor Larnach (3.009): $2.1MM
- Jhoan Duran (3.000): $3.7MM
- Royce Lewis (2.142): $2.3MM
White Sox (9)
- Nicky Lopez (5.139): $5.1MM
- Matt Foster (4.093): $900K
- Garrett Crochet (4.028): $2.9MM
- Enyel De Los Santos (4.015): $1.7MM
- Andrew Vaughn (4.000): $6.4MM
- Justin Anderson (3.122): $1.1MM
- Jimmy Lambert (3.108): $1.2MM
- Gavin Sheets (3.076): $2.6MM
- Steven Wilson (3.000): $1MM
Yankees (10)
- Jon Berti (5.168): $3.8MM
- Tim Mayza (5.129): $4MM
- Nestor Cortes (5.094): $7.7MM
- Jose Trevino (5.063): $3.4MM
- Trent Grisham (5.060): $5.7MM
- JT Brubaker (5.000): $2.275MM
- Jazz Chisholm Jr. (4.075): $6.9MM
- Mark Leiter Jr. (4.031): $2.1MM
- Clarke Schmidt (3.148): $3.5MM
- Scott Effross (2.156): $900K
Projected Arbitration Salaries For 2024
Matt Swartz has created a model to project salaries for arbitration eligible players, which we’ve been publishing at MLB Trade Rumors for 13 years.
In the baseball industry, teams and agents determine arbitration salaries by identifying comparable players. To project the entire arbitration class in this way would take a massive amount of time and effort. So, Matt has developed an algorithm to project arbitration salaries that looks at the player’s playing time, position, role, and performance statistics while accounting for inflation. The performance of comparable players matters, but our system is not directly selecting individual comps for each individual player.
As a disclaimer, it should be emphasized that our projections are not to be used as a scorecard for the agent and team on an individual player level. A player doing better or worse than our projection isn’t indicative of anything. Our arbitration projections are created as a tool for our readers to get a general idea of a team’s payroll situation.
While the service time figures included are official, there is not yet an established Super Two cutoff, which delineates which players with between two and three years of service qualify for early arbitration. That could lead to a few late entrants being added to the list. It’s also worth noting that contracts signed prior to the non-tender deadline aren’t generally considered to be normal arbitration comparables; contracts signed prior to that deadline can be skewed by light offers that are presented to borderline non-tender candidates in take-it-or-leave-it fashion (with “leave it,” in such instances, being a non-tender). That’s not universal to all pre-tender deals but is frequently applicable.
If you find MLBTR’s arbitration projections useful, please consider supporting us with a subscription. Trade Rumors Front Office subscribers received early access to these arbitration projections, and the subscription also includes the best research tools you can get without actually working for an MLB team: our contract tracker, and our agency database.
The projections:
Angels (10)
- Griffin Canning (4.075): $2.5MM
- Brett Phillips (4.060): $1.4MM
- Luis Rengifo (4.043): $4.2MM
- Jaime Barria (4.035): $1.5MM
- Chad Wallach (4.018): $1.1MM
- Taylor Ward (3.164): $4.5MM
- Patrick Sandoval (3.149): $5MM
- Jared Walsh (3.114): $2.7MM
- Jose Suarez (3.084): $1.1MM
- Jose Quijada (3.046): $1MM
Astros (7)
- Framber Valdez (4.163): $12.1MM
- Kyle Tucker (4.079): $12.6MM
- Jose Urquidy (4.049): $3.5MM
- Mauricio Dubon (3.162): $3.1MM
- Luis Garcia (3.083): $2.1MM
- Bryan Abreu (3.022): $2MM
- Chas McCormick (3.000): $3.1MM
Athletics (6)
- Austin Pruitt (5.034): $1.2MM
- Sean Newcomb (4.113): $1MM
- Paul Blackburn (4.018): $3.2MM
- Carlos Perez (3.167): $1.2MM
- Seth Brown (3.104): $2.4MM
- James Kaprielian (2.167): $1.5MM
Blue Jays (13)
- Adam Cimber (5.156): $3.2MM
- Trevor Richards (5.084): $2.4MM
- Danny Jansen (5.050): $5.2MM
- Vladimir Guerrero Jr. (4.157): $20.4MM
- Tim Mayza (4.156): $3.3MM
- Cavan Biggio (4.129): $3.7MM
- Erik Swanson (4.096): $2.7MM
- Jordan Romano (4.051): $7.7MM
- Genesis Cabrera (4.011): $1.4MM
- Santiago Espinal (3.149): $2.5MM
- Daulton Varsho (3.128): $5.5MM
- Alejandro Kirk (3.047): $2.6MM
- Nate Pearson (3.005): $800K
Braves (13)
- A.J. Minter (5.154): $6.5MM
- Max Fried (5.148): $14.4MM
- Yonny Chirinos (5.114): $2MM
- Michael Soroka (5.009): $3MM
- Nick Anderson (4.153): $1.6MM
- Nicky Lopez (4.139): $3.9MM
- Kolby Allard (3.162): $1MM
- Ben Heller (3.102): $900K
- Sam Hilliard (3.094): $1.1MM
- Michael Tonkin (3.074): $1MM
- Kyle Wright (3.062): $1.4MM
- Andrew Velazquez (3.033): $740K
- Huascar Ynoa (3.011): $1MM
Brewers (12)
- Brandon Woodruff (5.161): $11.6MM
- Willy Adames (5.105): $12.4MM
- Corbin Burnes (5.049): $15.1MM
- Adrian Houser (5.010): $5.6MM
- Rowdy Tellez (5.004): $5.9MM
- Eric Lauer (4.111): $5.2MM
- Hoby Milner (4.068): $1.7MM
- Devin Williams (4.056): $6.5MM
- Tyrone Taylor (3.093): $1.7MM
- Bryse Wilson (3.036): $1.3MM
- Joel Payamps (3.027): $1.7MM
- Abraham Toro (3.011): $1.3MM
Cardinals (10)
- Jacob Barnes (5.112): $1MM
- Tyler O’Neill (5.059): $5.5MM
- Dakota Hudson (4.156): $3.7MM
- Tommy Edman (4.114): $6.5MM
- Ryan Helsley (4.105): $3MM
- Andrew Knizner (4.021): $2MM
- Dylan Carlson (3.104): $1.8MM
- Jake Woodford (3.048): $1.1MM
- JoJo Romero (3.045): $900K
- John King (2.148): $1.0MM
Cubs (9)
- Codi Heuer (4.000): $785K
- Nick Madrigal (3.163): $1.9MM
- Mike Tauchman (3.143): $2MM
- Nick Burdi (3.140): $800K
- Julian Merryweather (3.109): $1.3MM
- Patrick Wisdom (3.058): $2.6MM
- Adbert Alzolay (3.050): $2.5MM
- Mark Leiter Jr. (3.031): $1.6MM
- Justin Steele (2.143): $4.1MM
Diamondbacks (8)
- Christian Walker (5.124): $12.7MM
- Paul Sewald (5.072): $7.3MM
- Austin Adams (4.150): $1.1MM
- Zac Gallen (4.100): $10.9MM
- Ryan Thompson (3.095): $1.3MM
- Kyle Lewis (3.067): $1.61MM
- Kevin Ginkel (3.032): $1.4MM
- Joe Mantiply (3.029): $1MM
Dodgers (13)
- Walker Buehler (5.168): $8.03MM
- Ryan Yarbrough (5.117): $3.8MM
- Caleb Ferguson (5.093): $2.3MM
- Yency Almonte (4.143): $1.9MM
- Will Smith (4.090): $9.3MM
- Dustin May (4.059): $2.4MM
- Brusdar Graterol (3.167): $2.5MM
- Wander Suero (3.144): $900K
- Evan Phillips (3.136): $3.4MM
- Gavin Lux (3.114): $1.1MM
- J.P. Feyereisen (3.108): $1MM
- Alex Vesia (3.078): $1.2MM
- Victor Gonzalez (3.058): $1MM
Giants (6)
- Austin Slater (5.147): $3.6MM
- J.D. Davis (5.137): $6.8MM
- Mike Yastrzemski (4.128): $7.3MM
- LaMonte Wade Jr. (4.035): $3.3MM
- Tyler Rogers (4.034): $3.2MM
- Thairo Estrada (3.169): $4.8MM
Guardians (10)
- Shane Bieber (5.097): $12.2MM
- Cam Gallagher (5.073): $1.3MM
- Ramon Laureano (4.165): $4.7MM
- Cal Quantrill (4.132): $6.6MM
- Josh Naylor (4.127): $7.2MM
- James Karinchak (3.099): $1.9MM
- Triston McKenzie (3.074): $1.8MM
- Enyel De Los Santos (3.015): $1.2MM
- Sam Hentges (2.157): $1.1MM
- Nick Sandlin (2.157): $1.1MM
Marlins (13)
- Jacob Stallings (5.149): $3.6MM
- Tanner Scott (5.059): $5.8MM
- Garrett Hampson (5.010): $1.3MM
- Luis Arraez (4.121): $10.8MM
- JT Chargois (4.101): $1.2MM
- Jesus Luzardo (3.165): $5.9MM
- A.J. Puk (3.124): $1.8MM
- Steven Okert (3.109): $1.2MM
- Trevor Rogers (3.094): $1.5MM
- Jazz Chisholm Jr. (3.075): $2.8MM
- Jonathan Davis (3.035): $800K
- Anthony Bender (2.153): $900K
- Jesus Sanchez (2.118): $2MM
Mariners (8)
- Ty France (4.089): $7.2MM
- Luis Torrens (3.155): $1.3MM
- Trent Thornton (3.148): $1.4MM
- Josh Rojas (3.126): $3.5MM
- Sam Haggerty (3.044): $800K
- Justin Topa (3.044): $1.5MM
- Mike Ford (3.008): $1.5MM
- Logan Gilbert (2.144): $4.9MM
Mets (17)
- Daniel Vogelbach (5.138): $2.6MM
- Trevor Gott (5.057): $2MM
- Elieser Hernandez (5.044): $1.6MM
- Drew Smith (5.034): $2.3MM
- Pete Alonso (5.000): $22MM
- Luis Guillorme (4.159): $1.7MM
- Tim Locastro (4.122): $1.6MM
- Joey Lucchesi (4.112): $2MM
- Sam Coonrod (4.078): $900K
- Jeff Brigham (3.142): $1.1MM
- John Curtiss (3.137): $1MM
- Michael Perez (3.095): $800K
- David Peterson (3.089): $2MM
- Danny Mendick (3.058): $1.1MM
- Rafael Ortega (3.035): $1.4MM
- DJ Stewart (2.168): $1.5MM
- Phil Bickford (2.134): $1.2MM
Nationals (8)
- Dominic Smith (5.081): $4.3MM
- Victor Robles (5.033): $2.7MM
- Tanner Rainey (4.127): $1.5MM
- Michael Chavis (4.089): $1.2MM
- Hunter Harvey (4.047): $2.2MM
- Lane Thomas (4.014): $7MM
- Kyle Finnegan (4.000): $5.1MM
- Luis Garcia (2.142): $2.4MM
Orioles (16)
- Anthony Santander (5.162): $12.7MM
- Danny Coulombe (5.008): $2.2MM
- John Means (5.007): $5.93MM
- Ryan O’Hearn (4.170): $3MM
- Cedric Mullins (4.078): $6.4MM
- Austin Hays (4.057): $6.1MM
- Dillon Tate (4.048): $1.5MM
- Jorge Mateo (4.000): $2.9MM
- Ryan Mountcastle (3.105): $4.2MM
- Cionel Perez (3.085): $1.3MM
- Cole Irvin (3.083): $1.8MM
- Keegan Akin (3.079): $800K
- Jacob Webb (3.046): $1.2MM
- Ramon Urias (3.025): $2MM
- Tyler Wells (2.132): $2.3MM
- Ryan McKenna (2.123): $740K
Padres (6)
- Juan Soto (5.134): $33MM
- Tim Hill (5.112): $2.4MM
- Scott Barlow (5.030): $7.1MM
- Trent Grisham (4.060): $4.9MM
- Austin Nola (4.045): $2.35MM
- Adrian Morejon (3.140): $900K
Phillies (8)
- Jeff Hoffman (5.084): $2.1MM
- Ranger Suarez (4.112): $4.7MM
- Gregory Soto (4.102): $4.9MM
- Jake Cave (4.071): $1.4MM
- Edmundo Sosa (3.140): $1.7MM
- Dylan Covey (3.138): $1MM
- Garrett Stubbs (3.120): $900K
- Alec Bohm (3.106): $4.3MM
Pirates (6)
- Ryan Borucki (5.006): $1.3MM
- Miguel Andujar (4.053): $2.2MM
- Mitch Keller (4.026): $6MM
- JT Brubaker (4.000): $2.28MM
- David Bednar (3.076): $4.7MM
- Connor Joe (2.136): $2MM
Rangers (10)
- Matt Bush (5.058): $2.1MM
- Brett Martin (4.151): $1.28MM
- Nathaniel Lowe (3.145): $8.8MM
- Jonathan Hernandez (3.131): $1.3MM
- Jonah Heim (3.097): $3.6MM
- Adolis Garcia (3.095): $6.6MM
- Dane Dunning (3.083): $3.4MM
- Brock Burke (3.065): $1.1MM
- Josh Sborz (3.055): $900K
- Leody Taveras (2.124): $2.4MM
Rays (16)
- Raimel Tapia (5.144): $2.4MM
- Shawn Armstrong (5.113): $1.8MM
- Andrew Kittredge (5.070): $2.3MM
- Jalen Beeks (5.003): $1.8MM
- Harold Ramirez (4.124): $4.4MM
- Colin Poche (4.114): $2.1MM
- Aaron Civale (4.058): $4.6MM
- Zack Littell (4.043): $1.7MM
- Christian Bethancourt (4.038): $2.3MM
- Cole Sulser (3.157): $900K
- Jason Adam (3.132): $3MM
- Randy Arozarena (3.129): $9MM
- Drew Rasmussen (3.111): $2.2MM
- Isaac Paredes (2.160): $3.2MM
- Shane McClanahan (2.158): $3.6MM
- Josh Fleming (2.144): $1MM
Red Sox (5)
- Nick Pivetta (5.166): $6.9MM
- Alex Verdugo (5.078): $9.2MM
- Luis Urias (4.098): $4.7MM
- Reese McGuire (4.027): $1.7MM
- John Schreiber (3.027): $1.3MM
Reds (10)
- Lucas Sims (5.014): $2.8MM
- Nick Senzel (4.150): $3MM
- Derek Law (4.081): $1.4MM
- Justin Dunn (4.020): $900K
- Tejay Antone (4.000): $900K
- Alex Young (3.143): $1.7MM
- Jake Fraley (3.097): $2.2MM
- Tyler Stephenson (3.056): $2.9MM
- Jonathan India (3.000): $3.7MM
- Vladimir Gutierrez (2.127): $1MM
Rockies (7)
- Harold Castro (4.141): $1.8MM
- Austin Gomber (4.111): $3.3MM
- Brendan Rodgers (4.075): $3.3MM
- Ty Blach (3.135): $1.8MM
- Peter Lambert (3.128): $1.2MM
- Austin Wynns (3.090): $1MM
- Lucas Gilbreath (2.148): $800K
Royals (8)
- Taylor Clarke (4.120): $2.2MM
- Josh Taylor (4.118): $1.3MM
- Josh Staumont (4.071): $1.2MM
- Taylor Hearn (3.165): $1.7MM
- Brady Singer (3.156): $5.1MM
- Kris Bubic (3.135): $2.4MM
- Edward Olivares (3.049): $1.8MM
- Carlos Hernandez (2.145): $1.3MM
Tigers (8)
- Austin Meadows (5.074): $4.3MM
- Spencer Turnbull (4.167): $2.4MM
- Tyler Alexander (4.058): $2MM
- Trey Wingenter (4.017): $1.1MM
- Tarik Skubal (3.114): $2.6MM
- Casey Mize (3.111): $1.2MM
- Jake Rogers (3.040): $2MM
- Akil Baddoo (2.119): $1.7MM
Twins (9)
- Caleb Thielbar (5.131): $3MM
- Kyle Farmer (5.129): $6.6MM
- Jordan Luplow (5.025): $1.6MM
- Willi Castro (4.017): $3.2MM
- Jorge Alcala (4.014): $1MM
- Ryan Jeffers (3.089): $2.3MM
- Jose De Leon (3.062): $740K
- Alex Kirilloff (2.141): $1.7MM
- Nick Gordon (2.136): $1MM
White Sox (8)
- Clint Frazier (4.092): $900K
- Dylan Cease (4.089): $8.8MM
- Michael Kopech (4.041): $3.6MM
- Trayce Thompson (4.010): $1.7MM
- Matt Foster (3.093): $740K
- Touki Toussaint (3.071): $1.7MM
- Garrett Crochet (3.028): $900K
- Andrew Vaughn (3.000): $3.7MM
Yankees (17)
- Lou Trivino (5.163): $4.1MM
- Gleyber Torres (5.162): $15.3MM
- Clay Holmes (5.031): $6MM
- Jonathan Loaisiga (5.022): $2.5MM
- Kyle Higashioka (5.005): $2.3MM
- Franchy Cordero (4.160): $1.6MM
- Domingo German (4.142): $4.4MM
- Nestor Cortes (4.094): $3.9MM
- Jose Trevino (4.063): $2.7MM
- Matt Bowman (4.043): $1MM
- Michael King (4.004): $2.6MM
- Ryan Weber (3.167): $900K
- Billy McKinney (3.087): $1.2MM
- Jake Bauers (3.084): $1.7MM
- Jimmy Cordero (3.061): $900K
- Clarke Schmidt (2.148): $2.6MM
- Albert Abreu (2.118): $900K
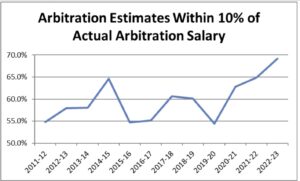
The MLB Trade Rumors Arbitration Model Had Its Best Year Ever
With the last of the arbitration hearings officially in the books, we can now officially report that this was the most accurate year that the MLB Trade Rumors Arbitration Model has ever had. The model estimated salaries within ten percent of salaries for 69% of cases – breaking the previous record of 65% and well above the 54% low point just three years ago.
When I began working on this model way back in 2011, I defined success based on how often my model was within ten percent of the actual arbitration salary for all arbitration-eligible players who signed one-year deals. The initial goal was to be within ten percent for half of such cases. For the 2011-12 arbitration season, the model was within ten percent on 55% of all cases. The model has consistently been in that range or higher, peaking at 65% in the 2014-15 arbitration season, while only dipping below it once with 54% in 2019-20. It averaged 58% over its first nine years.
Over that time, I repeatedly ran tests on the model, considered new modeling techniques, and had discussions with agents and others with experience in the arbitration space about how to improve the model. There were steps forward, although after picking each piece of low-hanging fruit, the gains were smaller. Ultimately, I pivoted to a focus on more accurate and cleaner data. This was initially something that Bryan Grosnick helped with behind the scenes, and Darragh McDonald took over last year. They both helped tremendously.
One important process change that I incorporated into model updates in recent years is checking which players would have been the “biggest misses” after updating the model. In many cases, the salaries that “missed” were not reflective of the actual salaries earned. Yet the model was awkwardly contorting itself to fit those purported outcomes. Some of the process of improving data quality was just a matter of finding typos. But in many cases, it was about correctly identifying the “true” arbitration salary a player received. When players avoid arbitration via settlement, they often get performance bonuses, signing bonuses, options for future years, or multi-year agreements. These cases are incorporated into the modeling process where appropriate, but sometimes the “salary” a player literally earned was not really intended to account for the actual arbitration award he would have gotten at a hearing. Cleaning the data involved some subjectivity, but it was designed to better record the intended salary that teams and agents were treating as a baseline when they negotiated more complicated agreements.
More tedious updates to data accuracy are not the most thrilling part of model building. Coming up with creative mathematical methods or just innovative variables to utilize is a more rewarding intellectual exercise for the researcher. But the truth is that better data is often more important than a slightly smarter model. I will continue to evolve the model based on the relevant statistics and factors utilized in the arbitration process, but in recent years I ultimately improved the model more with better data without structuring it differently.
As a result, the model should be more accurate in future years than it has been in the past. See below for a graph showing the performance of the model each year.
Projected Arbitration Salaries For 2023
Matt Swartz has created a model to project salaries for arbitration eligible players, which we’ve been publishing at MLB Trade Rumors for 12 years.
In the baseball industry, teams and agents determine arbitration salaries by identifying comparable players. To project the entire arbitration class in this way would take a massive amount of time and effort. So, Matt has developed an algorithm to project arbitration salaries that looks at the player’s playing time, position, role, and performance statistics while accounting for inflation. The performance of comparable players matters, but our system is not directly selecting individual comps for each individual player.
As a disclaimer, it should be emphasized that our projections are not to be used as a scorecard for the agent and team on an individual player level. A player doing better or worse than our projection isn’t indicative of anything. Our arbitration projections are created as a tool for our readers to get a general idea of a team’s payroll situation.
The service time figures, listed in parentheses below, are official. However, there is not yet an established Super Two cutoff. That could lead to a few late entrants being added to the list. It’s also worth noting that contracts signed prior to the non-tender deadline aren’t generally considered to be normal arbitration comparables; contracts signed prior to that deadline can be skewed by light offers that are presented to borderline non-tender candidates in take-it-or-leave-it fashion (with “leave it,” in such instances, being a non-tender). That’s not universal to all pre-tender deals but is frequently applicable.
If you find MLBTR’s arbitration projections useful, please consider supporting us with a subscription.
Onto the numbers…
Angels (7)
- Griffin Canning (3.075): $1.1MM
- Luis Rengifo (3.043): $2.4MM
- Jaime Barria (3.035): $1.2MM
- Chad Wallach (3.030): $800K
- Jared Walsh (3.010): $2.7MM
- Taylor Ward (2.164): $2.9MM
- Patrick Sandoval (2.149): $2.8MM
Astros (9)
- Phil Maton (5.047): $2.5MM
- Ryne Stanek (5.038): $3.1MM
- Framber Valdez (3.163): $7.4MM
- Josh James (3.110): $800K
- Kyle Tucker (3.079): $5.6MM
- Jose Urquidy (3.049): $3.2MM
- Cristian Javier (3.000): $3.3MM
- Blake Taylor (3.000): $800K
- Mauricio Dubon (2.162): $1.2MM
Athletics (6)
- Tony Kemp (5.098): $3.9MM
- Deolis Guerra (4.071): $900K
- Austin Pruitt (4.055): $1.2MM
- Ramon Laureano (3.165): $3.6MM
- Sean Murphy (3.029): $3.5MM
- Paul Blackburn (3.018): $1.9MM
Blue Jays (13)
- Teoscar Hernandez (5.097): $14.1MM
- Raimel Tapia (5.020): $5.2MM
- Adam Cimber (4.156): $3.2MM
- Trevor Richards (4.084): $1.5MM
- Bradley Zimmer (4.077): $1.3MM
- Danny Jansen (4.050): $3.7MM
- Vladimir Guerrero Jr. (3.157): $14.8MM
- Tim Mayza (3.156): $1.9MM
- Cavan Biggio (3.129): $2.6MM
- Trent Thornton (3.073): $1.1MM
- Bo Bichette (3.063): $6.1MM
- Jordan Romano (3.051): $4.4MM
- Santiago Espinal (2.149): $2.1MM
Braves (6)
- Guillermo Heredia (5.112): $1.1MM
- A.J. Minter (4.154): $5MM
- Max Fried (4.148): $12.2MM
- Mike Soroka (4.122): $2.8MM
- Tyler Matzek (4.019): $1.8MM
- Silvino Bracho (3.099): $900K
Brewers (18)
- Hunter Renfroe (5.165): $11.2MM
- Brent Suter (5.161): $3.1MM
- Victor Caratini (5.051): $2.8MM
- Luis Perdomo (5.034): $1MM
- Brandon Woodruff (4.161): $11MM
- Matt Bush (4.132): $2MM
- Willy Adames (4.105): $9.2MM
- Trevor Gott (4.057): $1.4MM
- Corbin Burnes (4.049): $11.4MM
- Eric Lauer (4.033): $5.2MM
- Jandel Gustave (4.027): $900K
- Adrian Houser (4.010): $3.6MM
- Rowdy Tellez (4.004): $5.3MM
- Luis Urias (3.120): $4.3MM
- Hoby Milner (3.068): $1.1MM
- Devin Williams (3.056): $3.2MM
- Mike Brosseau (3.031): $1.2MM
- Keston Hiura (3.009): $2MM
Cardinals (11)
- Jordan Montgomery (5.153): $10.1MM
- Chris Stratton (5.100): $3.5MM
- Alex Reyes (5.056): $2.85MM
- Jack Flaherty (5.006): $5.1MM
- Jordan Hicks (5.000): $1.6MM
- Dakota Hudson (4.062): $2.7MM
- Tyler O’Neill (4.059): $5.1MM
- Tommy Edman (3.114): $4.3MM
- Ryan Helsley (3.105): $2.4MM
- Andrew Knizner (3.021): $1MM
- Genesis Cabrera (3.011): $1.2MM
Cubs (10)
- Ian Happ (5.036): $10.6MM
- Steven Brault (4.167): $1.7MM
- Franmil Reyes (4.115): $6MM
- Rowan Wick (3.114): $1.5MM
- Alec Mills (3.097): $800K
- Brad Wieck (3.085): $800K
- Nico Hoerner (3.014): $2.2MM
- Codi Heuer (3.000): $800K
- Nick Madrigal (2.164): $1.1MM
- Rafael Ortega (2.145): $1.7MM
Diamondbacks (9)
- Caleb Smith (5.077): $2.7MM
- Keynan Middleton (5.023): $1.1MM
- Carson Kelly (4.161): $4.1MM
- Christian Walker (4.124): $7.3MM
- Reyes Moronta (4.111): $2MM
- Jordan Luplow (4.108): $2MM
- Zac Gallen (3.100): $4.5MM
- Josh Rojas (2.152): $2.4MM
- Daulton Varsho (2.128): $2.8MM
Dodgers (12)
- Cody Bellinger (5.160): $18.1MM
- Julio Urias (5.117): $13.7MM
- Walker Buehler (4.168): $8.1MM
- Caleb Ferguson (4.088): $1.1MM
- Yency Almonte (3.143): $1MM
- Will Smith (3.090): $5.2MM
- Dustin May (3.059): $1.4MM
- Trayce Thompson (3.010): $1.7MM
- Edwin Rios (3.003): $1.4MM
- Brusdar Graterol (2.167): $1.2MM
- Tony Gonsolin (2.152): $3.5MM
- Evan Phillips (2.136): $1.4MM
Giants (13)
- Jarlin Garcia (5.114): $2.4MM
- Scott Alexander (5.080): $1.1MM
- John Brebbia (5.078): $1.9MM
- Jakob Junis (5.002): $3.3MM
- Austin Slater (4.147): $2.7MM
- J.D. Davis (4.137): $3.8MM
- Jharel Cotton (3.162): $1.1MM
- Mike Yastrzemski (3.128): $5.7MM
- Zack Littell (3.067): $900K
- Logan Webb (3.044): $4.8MM
- LaMonte Wade Jr. (3.035): $1.4MM
- Tyler Rogers (3.034): $1.8MM
- Thairo Estrada (2.169): $2.4MM
Guardians (9)
- Luke Maile (5.148): $1.3MM
- Amed Rosario (5.062): $9MM
- Shane Bieber (4.097): $10.7MM
- Anthony Gose (3.139): $800K
- Cal Quantrill (3.132): $6MM
- Josh Naylor (3.1287): $3.5MM
- Zach Plesac (3.086): $2.9MM
- Aaron Civale (3.058): $2.2MM
- James Karinchak (2.169): $1.4MM
Marlins (12)
- Joey Wendle (5.088): $5.4MM (Marlins hold a $6.3MM mutual option and $75K buyout that will first need to be dealt with)
- Garrett Cooper (5.053): $4.1MM
- Dylan Floro (5.053): $4.2MM
- Brian Anderson (5.031): $5.2MM
- Jacob Stallings (4.149): $3.3MM
- Pablo Lopez (4.093): $5.6MM
- Tanner Scott (4.059): $2.7MM
- Elieser Hernandez (4.051): $1.8MM
- Jon Berti (3.168): $2.4MM
- Cole Sulser (3.028): $1MM
- Jeff Brigham (3.010): $800K
- Jesus Luzardo (2.165): $2MM
Mariners (11)
- Tom Murphy (5.092): $1.9MM
- Diego Castillo (4.118): $2.9MM
- Paul Sewald (4.072): $3.6MM
- Ryan Borucki (4.066): $1.1MM
- Casey Sadler (4.035): $1.025MM
- Dylan Moore (4.000): $2MM
- Erik Swanson (3.096): $1.4MM
- Luis Torrens (3.091): $1.2MM
- Ty France (3.089): $4.7MM
- Abraham Toro (2.149): $1.4MM
- Kyle Lewis (2.146): $1.2MM
Mets (8)
- Daniel Vogelbach (4.138): $2.9MM (Mets can bypass arbitration by exercising a $1.5MM club option)
- Tomas Nido (4.089): $1.6MM
- Dominic Smith (4.081): $4MM
- Jeff McNeil (4.069): $6.2MM
- Joey Lucchesi (4.067): $1.15MM
- Drew Smith (4.034): $1.2MM
- Pete Alonso (4.000): $15.9MM
- Luis Guillorme (3.167): $1.5MM
Nationals (10)
- Carl Edwards Jr. (5.169): $1.6MM
- Luke Voit (4.169): $8.2MM
- Erick Fedde (4.099): $3.6MM
- Victor Robles (4.033): $2.5MM
- Tanner Rainey (3.127): $1.5MM
- Hunter Harvey (3.047): $1MM
- Victor Arano (3.022): $1MM
- Lane Thomas (3.014): $2.1MM
- Ildemaro Vargas (3.007): $1.1MM
- Kyle Finnegan (3.000): $2MM
Orioles (7)
- Anthony Santander (4.162): $7.5MM
- Cam Gallagher (4.073): $1MM
- Austin Voth (3.127): $2MM
- Cedric Mullins (3.078): $4.4MM
- Austin Hays (3.057): $3.1MM
- Dillon Tate (3.048): $1.5MM
- Jorge Mateo (3.000): $1.8MM
Padres (10)
- Josh Hader (5.115): $13.6MM
- Jorge Alfaro (5.083): $3.6MM
- Juan Soto (4.134): $21.5MM
- Tim Hill (4.112): $1.7MM
- Austin Adams (4.015): $1MM
- Jose Castillo (3.125): $900K
- Austin Nola (3.106): $2.2MM
- Trent Grisham (3.060): $2.6MM
- Adrian Morejon (3.013): $800K
- Jake Cronenworth (3.000): $4.4MM
Phillies (7)
- Jose Alvarado (5.082): $3.2MM
- Rhys Hoskins (5.053): $12.6MM
- Seranthony Dominguez (4.131): $2MM
- Ranger Suarez (3.112): $3.5MM
- Sam Coonrod (3.078): $800K
- Yairo Munoz (3.003): $1MM
- Edmundo Sosa (2.140): $1MM
Pirates (6)
- Robert Stephenson (5.049): $1.9MM
- Kevin Newman (4.046): $2.8MM
- Miguel Andujar (4.002): $1.7MM
- Duane Underwood Jr. (3.044): $1MM
- Mitch Keller (3.026): $2.4MM
- JT Brubaker (3.000): $2MM
Rangers (6)
- Mitch Garver (5.045): $4.2MM
- Brett Martin (3.151): $1.5MM
- Taylor Hearn (3.125): $1.7MM
- Dennis Santana (3.095): $1.1MM
- Jonathan Hernandez (3.041): $1MM
- Nathaniel Lowe (2.145): $4.3MM
Rays (19)
- Ji-Man Choi (5.076): $4.5MM
- Yonny Chirinos (4.125): $1.6MM
- Yandy Diaz (4.122): $5.4MM
- Ryan Yarbrough (4.117): $4.2MM
- Shawn Armstrong (4.113): $1.3MM
- Jalen Beeks (4.070): $1.2MM
- Andrew Kittredge (4.070): $2MM
- Francisco Mejia (4.062): $2.2MM
- Jeffrey Springs (4.055): $3MM
- Roman Quinn (4.035): $900K
- Nick Anderson (3.153): $845K
- Harold Ramirez (3.124): $2.1MM
- Colin Poche (3.109): $1.7MM
- JT Chargois (3.101): $1MM
- Pete Fairbanks (3.057): $1.5MM
- Christian Bethancourt (3.038): $1.6MM
- Ryan Thompson (3.000): $1.1MM
- Jason Adam (2.132): $1.9MM
- Randy Arozarena (2.129): $4MM
Red Sox (11)
- Ryan Brasier (5.109): $2.3MM
- Rafael Devers (5.070): $16.9MM
- Abraham Almonte (5.012): $900K
- Nick Pivetta (4.166): $5.9MM
- Franchy Cordero (4.092): $1.5MM
- Alex Verdugo (4.078): $6.9MM
- Rob Refsnyder (4.048): $1.6MM
- Christian Arroyo (4.036): $2.2MM
- Josh Taylor (3.121): $1.1MM
- Reese McGuire (3.027): $1.3MM
- Yu Chang (3.007): $900K
Reds (11)
- Buck Farmer (5.140): $1.4MM
- Luis Cessa (5.131): $2.6MM
- Kyle Farmer (4.129): $5.9MM
- Jeff Hoffman (4.105): $1.2MM
- Lucas Sims (4.014): $1.3MM
- Nick Senzel (3.150): $2.2MM
- Derek Law (3.081): $900K
- Aramis Garcia (3.036): $800K
- Justin Dunn (3.016): $1.1MM
- Aristides Aquino (3.003): $1.6MM
- Tejay Antone (3.000): $800K
Rockies (6)
- Dinelson Lamet (5.070): $4.8MM
- Garrett Hampson (4.030): $2.1MM
- Tyler Kinley (4.014): $1.3MM
- Austin Gomber (3.111): $1.8MM
- Brendan Rodgers (3.075): $2.7MM
- Ty Blach (3.007): $800K
Royals (11)
- Luke Weaver (5.112): $3MM
- Amir Garrett (5.099): $2.6MM
- Adalberto Mondesi (5.088): $3MM
- Brad Keller (5.000): $7MM
- Scott Barlow (4.030): $4.9MM
- Ryan O’Hearn (4.002): $1.5MM
- Nicky Lopez (3.139): $3.4MM
- Taylor Clarke (3.120): $1.5MM
- Josh Staumont (3.072): $1MM
- Brady Singer (2.156): $2.9MM
- Kris Bubic (2.135): $1.8MM
Tigers (12)
- Drew Hutchison (5.097): $1.8MM
- Joe Jimenez (5.061): $2.6MM
- Jeimer Candelario (5.038): $7MM
- Jose Cisnero (5.020): $2.2MM
- Victor Reyes (4.075): $2.2MM
- Austin Meadows (4.074): $4MM
- Harold Castro (3.141): $2.6MM
- Gregory Soto (3.102): $3.1MM
- Tyler Alexander (3.058): $1.6MM
- Willi Castro (3.017): $1.7MM
- Rony Garcia (2.138): $1MM
- Kyle Funkhouser (2.133): $800K
Twins (12)
- Gio Urshela (5.127): $9.2MM
- Emilio Pagan (5.091): $3.7MM
- Tyler Mahle (5.018): $7.2MM
- Caleb Thielbar (4.131): $2.4MM
- Jorge Lopez (4.102): $3.7MM
- Danny Coulombe (4.008): $800K
- Chris Paddack (4.000): $2.4MM
- Jake Cave (3.137): $1.2MM
- Luis Arraez (3.121): $5MM
- Cody Stashak (3.064): $800K
- Jorge Alcala (3.014): $800K
- Kyle Garlick (2.163): $1.1MM
White Sox (8)
- Lucas Giolito (5.080): $10.8MM
- Adam Engel (5.058): $2.3MM
- Kyle Crick (5.027): $1.5MM
- Reynaldo Lopez (5.004): $3.3MM
- Dylan Cease (3.089): $5.3MM
- Jose Ruiz (3.048): $1MM
- Michael Kopech (3.041): $2.2MM
- Danny Mendick (2.168): $1MM
Yankees (14)
- Wandy Peralta (5.168): $3.1MM
- Frankie Montas (5.015): $7.7MM
- Isiah Kiner-Falefa (5.000): $6.5MM
- Lou Trivino (4.163): $4.2MM
- Gleyber Torres (4.162): $9.8MM
- Clay Holmes (4.031): $2.9MM
- Jonathan Loaisiga (4.022): $2.1MM
- Domingo German (4.017): $2.6MM
- Lucas Luetge (4.015): $1.7MM
- Kyle Higashioka (4.005): $1.7MM
- Tim Locastro (3.122): $1.2MM
- Nestor Cortes (3.094): $3.5MM
- Jose Trevino (3.063): $2MM
- Michael King (3.004): $1.2MM
March 22 Set As New Date For Teams, Players To Exchange Arbitration Figures
Dozens of arbitration-eligible players still have to get their salaries figured out for the 2022 season, and now that the lockout is over, March 22 is the new deadline for teams and players to submit numbers, The Athletic’s Ken Rosenthal reports (Twitter link). Since a good number of these arbitration cases won’t be settled by March 22, this means arb hearings will stretch into the actual regular season, which is now set to begin on April 7.
As usual, teams will reduce their list of arbitration-eligibles via contract agreements prior to March 22, or perhaps even by trading or releasing some eligible players. Though the official non-tender deadline still took place just prior to the lockout, it could be that some clubs have simply changed their minds on some players, or have new priorities in terms of cutting or adding to payroll. With this in mind, the likelihood of even more players becoming available will only add to what already be an absolute frenzy of a free agent and trade market in the aftermath of the lockout.
The sheer amount of front office business could see a shift in how teams or players address these arbitration cases. While obviously both sides have a specific price in mind and aren’t going to agree to a major discount, there could be a little bit more sway on one side or the other just in the same of getting a deal done. The sooner an agreement is reached, the sooner the player can fully concentrate on getting ready for the season, and the team can check one item off a lengthy to-do list.
In recent years, clubs have been more apt to deploy the “file and trial” strategy of not negotiating (apart from discussing multi-year extensions) after the figure-exchange deadline for arb-eligible players. The strategy is to exert a bit of pressure on players to accept an arb-avoiding contract in advance of the deadline, so both sides can sidestep the uncertainty that often goes into an arbitration hearing. It remains to be seen if teams may be more willing to bend on talks post-deadline just in the name of getting a one-year settled pre-hearing, or if teams may perhaps be even more prone to “file and trial” tactics if they feel they have added leverage on particular players.
However, since hearings won’t take place until after Opening Day, some players will begin the season not knowing that they’ll exactly be earning, thus creating a very unusual situation and adding another wrinkle to a process that already lends itself to awkwardness. It isn’t uncommon for some hard feelings to develop from these hearings, and now a situation has been created where a team can openly criticize a player during a morning arbitration hearing, and then rely on that same player to be in the starting lineup of that evening’s game. While an arbiter will only be considering 2021 statistics in determining a 2022 salary, it is possible that some on-field events early in 2022 (a particularly hot or cold start by the player, or an injury) could impact how either side approaches presenting their case to the arbiter.
Of note, the 2021-22 arbitration-eligible players are all still subject to the rules of the previous collective bargaining agreement. That said, there also weren’t many big changes made to the arb process under the new CBA, as the league refused to even discuss the standards relating to the amount of service time required to gain salary arbitration, or even to the player’s desire for a large increase in the number of Super Two-eligible players. However, pre-arbitration players will now enter their arb years on higher base salaries, thanks to the new bonus pool system for pre-arbitration players and the increase in the minimum salary.
One interesting detail does exist, as MLBTR has learned that for players who will be arbitration-eligible for the first time next winter, their statistics from the shortened 2020 season will be extrapolated to fit what the player “would have” done had the season been a standard 162 games. A player who hit 10 home runs in 2020, for instance, would be treated as if he had hit 27 homers. This formula involving 2020’s statistics will be used for all future arbitration hearings going forward. However, no such formula exists regarding the 2020 season for this year’s arb class, so teams and players can make whatever arguments they wish in hearings given the lack of a uniform standard for how 2020 statistics should be addressed.
MLB Trade Rumors has used Matt Swartz’s model for projecting arbitration salaries for the last 11 years, and here are the projections for both the remaining arb-eligible players, as well as the numbers for the players who agreed to deals prior to the non-tender deadline.
The Value Of The MLBPA’s Super Two Proposal
In its most recent proposal, the Major League Baseball Players Association asked that 80% of players with at least two years of MLB service be considered arbitration eligible. This is up from 22%, which has been the cutoff since 2013 when it was increased from 17%. In the ongoing CBA negotiations, MLB has shown no interest in any change to the 22% figure. The MLBPA started these CBA talks at a position of making all 2+ players eligible for arbitration, which had been the case from the inception of salary arbitration in 1973 up until 1985.
I thought it might be interesting to attempt to quantify the MLBPA’s request. First, we should get an idea of how many additional players would be thrown into the arbitration system each year. As I mentioned on Twitter last week, the 80% request, if in effect this offseason, would mean changing the current Super Two cutoff from 2.116 (two years and 116 days of MLB service) to 2.028. Keep in mind that the Super Two cutoff is always a moving target.
By my count, under the 2.116 cutoff, 26 players currently qualify as Super Two this offseason, led by Vladimir Guerrero Jr., Austin Riley, and Bryan Reynolds.
Under a cutoff reduced to 2.028, 79 additional players would qualify as arbitration eligible. I’ve listed them below along with projected arbitration salaries from Matt Swartz. Note that our arbitration projection model sometimes spits out a number below the league minimum, in which case we set the projection equal to the minimum. For this exercise, we’ll use a minimum salary of $700K.
- Yordan Alvarez, Astros – $4.6MM
- Bo Bichette, Blue Jays – $4.6MM
- Will Smith, Dodgers – $3.8MM
- Kyle Tucker, Astros – $3.6MM
- Cedric Mullins, Orioles – $3.4MM
- Tommy Edman, Cardinals – $3.3MM
- Ty France, Mariners – $3.1MM
- Dylan Cease, White Sox – $3MM
- Tyler Rogers, Giants – $3MM
- Logan Webb, Giants – $2.9MM
- Zach Plesac, Guardians – $2.7MM
- Aaron Civale, Guardians – $2.6MM
- Jordan Romano, Blue Jays – $2.5MM
- Austin Hays, Orioles – $2.4MM
- Zac Gallen, Diamondbacks – $2.3MM
- Trent Grisham, Padres – $2.3MM
- Jose Urquidy, Astros – $2.2MM
- Sean Murphy, Athletics – $2.1MM
- Myles Straw, Guardians – $2MM
- Austin Gomber, Rockies – $2MM
- Nick Solak, Rangers – $2MM
- Gregory Soto, Tigers – $1.9MM
- Ranger Suarez, Phillies – $1.8MM
- Brendan Rodgers, Rockies – $1.8MM
- Alec Mills, Cubs – $1.7MM
- Nestor Cortes, Yankees – $1.7MM
- Touki Toussaint, Braves – $1.7MM
- Dustin May, Dodgers – $1.7MM
- LaMonte Wade, Giants – $1.7MM
- Austin Nola, Padres – $1.6MM
- Devin Williams, Brewers – $1.6MM
- Jaime Barria, Angels – $1.6MM
- Josh Staumont, Royals – $1.5MM
- Genesis Cabrera, Cardinals – $1.5MM
- Keston Hiura, Brewers – $1.5MM
- Griffin Canning, Angels – $1.4MM
- DJ Stewart, Orioles – $1.4MM
- Tyler Alexander, Tigers – $1.4MM
- Michael Kopech, White Sox – $1.4MM
- Cole Sulser, Orioles – $1.4MM
- Matt Beaty, Dodgers – $1.3MM
- Kolby Allard, Rangers – $1.3MM
- Pete Fairbanks, Rays – $1.3MM
- Oscar Mercado, Guardians – $1.3MM
- Steven Duggar, Giants – $1.2MM
- JT Chargois, Rays – $1.2MM
- Michael Chavis, Pirates – $1.2MM
- Jose Trevino, Rangers – $1.2MM
- Brad Wieck, Cubs – $1.1MM
- Zack Littell, Giants – $1.1MM
- Josh VanMeter, Diamondbacks – $1.1MM
- Mike Brosseau, Brewers – $1.1MM
- Rowan Wick, Cubs – $1MM
- Darwinzon Hernandez, Red Sox – $1MM
- Sam Coonrod, Phillies – $1MM
- Luis Rengifo, Angels – $1MM
- Justus Sheffield, Mariners – $1MM
- Dillon Tate, Orioles – $1MM
- Jose Ruiz, White Sox – $1MM
- Ryan Helsley, Cardinals – $900K
- Erik Swanson, Mariners – $900K
- Jacob Webb, Braves – $900K
- Anthony Alford, Pirates – $900K
- Duane Underwood, Pirates – $900K
- Edwin Rios, Dodgers – $900K
- Greg Allen, Pirates – $900K
- Sam Howard, Pirates – $800K
- Dennis Santana, Rangers – $800K
- Colin Poche, Rays – $700K
- Nick Margevicius, Mariners – $700K
- Austin Davis, Red Sox – $700K
- Hoby Milner, Brewers – $700K
- Cody Stashak, Twins – $700K
- Yoan Lopez, Phillies – $700K
- Hunter Harvey, Giants – $700K
- Jonathan Hernandez, Rangers – $700K
- Tyler Beede, Giants – $700K
- Javy Guerra, Padres – $700K
- Julian Fernandez, Rockies – $700K
To calculate how much additional money MLB teams would be paying under this system in 2022, I found the difference between the projected arbitration salary, and a hypothetical $700K minimum. So, for example, Yordan Alvarez and Bo Bichette would gain the most, an additional $3.9MM each in ’22. Note that it’s possible a few star players might make more than the league minimum even as a pre-arbitration player, like when Mookie Betts was renewed for $950K in 2017, but we aren’t modeling that in.
So, for these 79 additional Super Two players under the MLBPA’s proposal, we estimate that teams would pay an additional $72.4MM in 2022.
By itself, MLB might be willing to stomach something of that nature. They’ve shown a willingness to put $15MM into a pre-arbitration bonus pool, and I assume they could be pushed up higher if the players drop their request to change Super Two eligibility.
But there’s the rub: MLB doesn’t want any additional players thrown into the arbitration system. Doing so, particularly for star players, would increase that player’s total arbitration earnings by a significant amount, and also help push up the pay scale.
To illustrate this, we asked Matt Swartz to model out a couple of players who have been through the arbitration system already.
The first is Francisco Lindor. Lindor went through arbitration three times, earning salaries of $10.55MM in 2019, $17.5MM in 2020, and $22.3MM in 2021, for a total of $50.35MM. Under the MLBPA’s proposal, Lindor would have been arbitration eligible four times. This means he would have earned a lot more than the $623,200 he did in 2018 – 10.7 times as much, in our estimation. Here’s how our model saw a Lindor who went to arbitration four times, keeping his actual statistics the same:
- 2018: $623,200 -> $6.7MM
- 2019: $10.55MM -> $14.9MM
- 2020: $17.5MM -> $20.7MM
- 2021: $22.3MM -> $23.4MM
- Total: $50,973,200 -> $65.7MM
- Difference: $14,726,800
Our other example is Josh Bell. He’s also set to go through arbitration three times, earning $4.8MM in 2020, $6.35MM in 2021, and a projected $10MM in 2022 for a total of $21.15MM. Here’s how that might have played out had he gone through arbitration four times:
- 2019: $587K -> $2.8MM
- 2020: $4.8MM -> $8.1MM
- 2021: $6.35MM -> $9.6MM
- 2022: 10MM (projected) -> $13.2MM
- Total: $21,737,000 -> $33.7MM
- Difference: $11,963,000
The Pirates traded Bell in December 2020, knowing he was set to get a bump from $4.8MM to $6.35MM. MLB might argue that the Pirates would have traded Bell a year earlier if he was slated to jump from $2.8MM to $8.1MM. They might say that not only would expanding Super Two be bad for their pocketbooks, it’d be bad for “competitive balance.” I imagine the MLBPA would argue that the Pirates could have afforded Bell in either scenario.
There’s also the chance that shifting the arbitration pay scale a year earlier for a good number of players would simply result in them getting non-tendered a year earlier and hitting the free agent market. If you look at the list of 79 players above, you can be assured that many of them will not make it all the way through arbitration even if they earn the league minimum in 2022.
Looking at a player like Bell, if he was coming off a poor 2020 season and was set to earn $9.6MM instead of $6.35MM, he might have simply been non-tendered. As we’ve seen with an example like Kyle Schwarber, this is not necessarily a bad scenario for the player, since Schwarber earned more in free agency than he was projected to get in arbitration, and he’s set to parlay a strong bounceback year into a good multiyear contract.
If you wanted to model out the MLBPA’s 80% request further, you’d have to retroactively apply it to all the players who would’ve been affected and see how much money moves toward the players in that scenario. But it’d be impossible to guess who would’ve been non-tendered when, so it’s not an exact science. At any rate, we may learn this week whether MLB truly has any willingness to move off the 22% Super Two cutoff, even if it’s not to 80%.
Projected Arbitration Salaries For 2022
At some point, the MLB lockout will end and teams will be scrambling to address their arbitration eligible players. We’ve updated this post, removing players no longer on 40-man rosters. We’ve also moved traded players to the correct teams and added official service time as well as notes for pre-tender agreements.
Matt Swartz has created a model to project salaries for arbitration eligible players, which we’ve been publishing at MLB Trade Rumors for 11 years.
In the baseball industry, teams and agents determine arbitration salaries by identifying comparable players. To project the entire arbitration class in this way would take a massive amount of time and effort. So, Matt has developed an algorithm to project arbitration salaries that looks at the player’s playing time, position, role, and performance statistics while accounting for inflation. The performance of comparable players matters, but our system is not directly selecting comps for each individual player.
As a disclaimer, I should note that our projections are not to be used as a scorecard for the agent and team on an individual player level. A player doing better or worse than our projection isn’t indicative of anything. Our arbitration projections are created as a tool for our readers to get a general idea of a team’s payroll situation.
The Super Two cutoff is 2.116 in Major League service time. The service time figures below are official. We’ll make adjustments to any projection below the league minimum salary, once a new minimum is established. Also, please note that contracts signed prior to the non-tender deadline aren’t generally considered to be normal arbitration comparables.
If you find MLBTR’s arbitration projections useful, please consider supporting us with a subscription.
Angels (3)
- Max Stassi (5.049) – $2.7MM
- Mike Mayers (4.020) – $2.2MM
- Tyler Wade (3.088) – $700K
Astros (6)
- Rafael Montero (5.138) – $3.1MM
- Aledmys Diaz (5.100) – $4.0MM
- Phil Maton (4.047) – $1.4MM
- Ryne Stanek (4.038) – $2.1MM
- Josh James (3.005) – $700K
- Framber Valdez (2.163) – $3.2MM
Athletics (10)
- Sean Manaea (5.157) – $10.2MM
- Chris Bassitt (5.130) – $8.8MM
- Chad Pinder (5.047) – $2.8MM. Signed for $2.725MM prior to NT deadline
- Matt Chapman (4.109) – $9.5MM
- Matt Olson (4.103) – $12.0MM
- Tony Kemp (4.098) – $2.2MM. Signed for $2.25MM prior to NT deadline
- Frankie Montas (4.015) – $5.2MM
- Lou Trivino (3.163) – $2.9MM
- Deolis Guerra (3.071) – $900K. Signed for $815K prior to NT deadline
- Ramon Laureano (3.014) – $2.8MM
Blue Jays (10)
- Ross Stripling (5.115) – $4.4MM
- Teoscar Hernandez (4.097) – $10.0MM
- Adam Cimber (3.156) – $1.5MM
- Trevor Richards (3.084) – $1.1MM
- Ryan Borucki (3.066) – $800K
- Danny Jansen (3.050) – $1.5MM
- Vladimir Guerrero Jr. (2.157) – $7.9MM
- Tim Mayza (2.156) – $1.2MM
- Trent Thornton (2.150) – $900K
- Cavan Biggio (2.129) – $1.7MM
Braves (10)
- Adam Duvall (5.151) – $9.1MM
- Dansby Swanson (5.047) – $10.1MM
- Luke Jackson (5.019) – $3.8MM
- Guillermo Heredia (4.112) – $1.6MM. Signed for $1MM prior to NT deadline
- A.J. Minter (3.154) – $2.1MM
- Max Fried (3.148) – $7.1MM
- Mike Soroka (3.146) – $2.8MM
- Sean Newcomb (3.123) – $900K
- Tyler Matzek (3.019) – $1.5MM
- Austin Riley (2.138) – $4.3MM
Brewers (12)
- Jace Peterson (5.142) – $1.3MM. Signed for $1.825MM prior to NT deadline
- Omar Narvaez (5.089) – $4.1MM
- Hunter Renfroe (4.165) – $7.6MM
- Brent Suter (4.161) – $2.3MM
- Josh Hader (4.115) – $10.0MM
- Brandon Woodruff (3.161) – $7.1MM
- Willy Adames (3.105) – $4.0MM
- Corbin Burnes (3.049) – $4.0MM
- Eric Lauer (3.033) – $2.7MM
- Jandel Gustave (3.027) – $800K. Signed for $675K prior to NT deadline
- Adrian Houser (3.010) – $2.3MM
- Rowdy Tellez (3.004) – $1.9MM. Signed for $1.94MM prior to NT deadline
- Luis Urias (2.120) – $2.4MM
Cardinals (7)
- Alex Reyes (4.056) – $3.3MM
- Harrison Bader (4.030) – $3.7MM
- Jack Flaherty (4.006) – $5.1MM
- Jordan Hicks (4.000) – $1.0MM
- Giovanny Gallegos (3.085) – $2.8MM
- Dakota Hudson (3.066) – $1.7MM
- Tyler O’Neill (3.059) – $3.5MM
Cubs (3)
- Willson Contreras (5.108) – $8.7MM
- Ian Happ (4.036) – $6.5MM
- Harold Ramirez (2.124) – $1.6MM
Diamondbacks (7)
- Luke Weaver (4.112) – $2.7MM
- Noe Ramirez (4.083) – $1.8MM. Signed for $1.25MM prior to NT deadline
- Caleb Smith (4.078) – $2.1MM. Signed for $2MM prior to NT deadline
- Carson Kelly (3.161) – $3.0MM
- Christian Walker (3.124) – $2.7MM
- Jordan Luplow (3.112) – $1.5MM
- J.B. Wendelken (3.028) – $900K. Signed for $835K prior to NT deadline
Dodgers (4)
- Trea Turner (5.135) – $19.8MM
- Cody Bellinger (4.160) – $16.1MM. Signed for $17MM prior to NT deadline
- Julio Urias (4.117) – $8.8MM
- Caleb Ferguson (3.093) – $700K
Giants (7)
- Dominic Leone (5.168) – $1.5MM
- Curt Casali (5.151) – $2.0MM
- Darin Ruf (4.138) – $2.6MM
- Jarlin Garcia (4.114) – $1.8MM. Signed for $1.725MM prior to NT deadline
- John Brebbia (4.078) – $1.0MM. Signed for $837.5K prior to NT deadline
- Austin Slater (3.147) – $2.0MM. Signed for $1.85MM prior to NT deadline
- Mike Yastrzemski (2.128) – $3.1MM
Guardians (7)
- Austin Hedges (5.166) – $3.8MM
- Amed Rosario (4.062) – $5.0MM
- Franmil Reyes (3.115) – $4.4MM
- Shane Bieber (3.097) – $4.8MM
- Bradley Zimmer (3.077) – $1.5MM
- Cal Quantrill (2.132) – $2.8MM
- Josh Naylor (2.127) – $1.2MM
Mariners (10)
- Adam Frazier (5.075) – $7.2MM
- Mitch Haniger (5.048) – $8.5MM
- Drew Steckenrider (4.094) – $2.1MM
- Tom Murphy (4.092) – $1.7MM
- J.P. Crawford (3.163) – $5.0MM
- Diego Castillo (3.118) – $2.6MM
- Paul Sewald (3.072) – $1.8MM
- Casey Sadler (3.035) – $1.3MM. Signed for $1.025MM prior to NT deadline
- Dylan Moore (3.000) – $1.6MM
- Luis Torrens (2.118) – $1.6MM
Marlins (10)
- Jesus Aguilar (5.082) – $7.4MM
- Richard Bleier (5.074) – $2.5MM
- Joey Wendle (4.088) – $4.0MM
- Garrett Cooper (4.053) – $3.0MM
- Dylan Floro (4.053) – $2.4MM
- Brian Anderson (4.031) – $4.5MM
- Jacob Stallings (3.149) – $2.6MM
- Elieser Hernandez (3.118) – $1.4MM
- Pablo Lopez (3.093) – $2.5MM
- Jon Berti (2.168) – $1.2MM
Mets (13)
- Edwin Diaz (5.121) – $10.4MM
- Seth Lugo (5.082) – $3.7MM
- Miguel Castro (5.079) – $2.6MM
- Brandon Nimmo (5.042) – $6.0MM
- Trevor Williams (5.027) – $3.8MM
- Dominic Smith (3.146) – $4.0MM
- J.D. Davis (3.137) – $2.7MM
- Tomas Nido (3.089) – $900K
- Jeff McNeil (3.069) – $2.8MM
- Joey Lucchesi (3.067) – $1.6MM
- Drew Smith (3.034) – $900K
- Pete Alonso (3.000) – $7.3MM
- Luis Guillorme (2.167) – $700K
Nationals (8)
- Josh Bell (5.053) – $10.0MM
- Joe Ross (5.018) – $3.0MM
- Juan Soto (3.134) – $16.2MM
- Erick Fedde (3.099) – $1.9MM
- Victor Robles (3.033) – $1.7MM
- Austin Voth (2.127) – $1.0MM
- Tanner Rainey (2.127) – $800K
- Andrew Stevenson (2.127) – $900K. Signed for $850K prior to NT deadline
Orioles (6)
- Trey Mancini (5.015) – $7.9MM
- Anthony Santander (3.162) – $3.7MM. Signed for $3.15MM prior to NT deadline
- Jorge Lopez (3.102) – $1.5MM. Signed for $1.5MM prior to NT deadline
- Paul Fry (3.075) – $1.1MM. Signed for $850K prior to NT deadline
- Tanner Scott (3.059) – $1.0MM
- John Means (3.007) – $3.1MM
Padres (8)
- Joe Musgrove (5.063) – $8.9MM
- Dinelson Lamet (4.130) – $4.6MM
- Emilio Pagan (4.091) – $2.3MM. Signed for $2.3MM prior to NT deadline
- Jorge Alfaro (4.083) – $2.7MM
- Victor Caratini (4.051) – $2.1MM
- Tim Hill (3.112) – $1.4MM. Signed for $1.325MM prior to NT deadline
- Austin Adams (3.015) – $1.0MM. Signed for $925K prior to NT deadline
- Chris Paddack (3.000) – $2.1MM
Phillies (4)
- Zach Eflin (5.018) – $6.0MM
- Jose Alvarado (4.088) – $1.9MM
- Rhys Hoskins (4.053) – $7.6MM
- Seranthony Dominguez (3.131) – $800K. Signed for $725K prior to NT deadline
Pirates (4)
- Ben Gamel (5.029) – $2.9MM. Signed for $1.8MM prior to NT deadline
- Chris Stratton (4.100) – $2.2MM
- Kevin Newman (3.046) – $2.2MM
- Bryan Reynolds (2.163) – $4.5MM
Rangers (4)
- Isiah Kiner-Falefa (4.000) – $4.9MM
- Willie Calhoun (3.033) – $1.6MM
- Brett Martin (2.151) – $1.1MM
- Taylor Hearn (2.140) – $1.1MM
Rays (14)
- Matt Wisler (5.042) – $1.8MM
- Manuel Margot (5.012) – $5.0MM
- Tyler Glasnow (4.158) – $5.8MM
- Ji-Man Choi (4.076) – $3.5MM. Signed prior to NT deadline for $3.2MM
- Ryan Yarbrough (3.147) – $4.4MM
- Yonny Chirinos (3.137) – $1.2MM
- Yandy Diaz (3.122) – $2.7MM
- Austin Meadows (3.074) – $4.3MM
- Andrew Kittredge (3.070) – $1.6MM
- Jalen Beeks (3.070) – $600K
- Francisco Mejia (3.062) – $1.5MM
- Jeffrey Springs (3.055) – $1.0MM
- Brett Phillips (3.013) – $1.2MM
- Nick Anderson (3.000) – $900K
Red Sox (7)
- Kevin Plawecki (5.167) – $2.0MM. Signed for $2.25MM after NT deadline
- Ryan Brasier (4.109) – $1.4MM. Signed for $1.4MM prior to NT deadline
- Rafael Devers (4.070) – $11.1MM
- Nick Pivetta (3.166) – $3.2MM
- Alex Verdugo (3.078) – $3.2MM
- Christian Arroyo (3.036) – $1.1MM
- Josh Taylor (2.121) – $1.1MM
Reds (10)
- Tyler Naquin (5.033) – $3.6MM
- Luis Cessa (4.131) – $1.6MM
- Luis Castillo (4.101) – $7.6MM
- Amir Garrett (4.099) – $2.2MM
- Jesse Winker (4.080) – $6.8MM
- Tyler Mahle (4.018) – $5.6MM
- Kyle Farmer (3.129) – $2.2MM
- Jeff Hoffman (3.105) – $1.1MM
- Lucas Sims (3.014) – $1.2MM
- Nick Senzel (2.150) – $1.1MM
Rockies (9)
- Daniel Bard (5.103) – $4.8MM. Signed for $4.4MM prior to NT deadline
- Carlos Estevez (5.022) – $3.2MM
- Kyle Freeland (4.144) – $7.0MM
- Robert Stephenson (4.049) – $1.1MM
- Raimel Tapia (4.020) – $3.9MM
- Ryan McMahon (4.006) – $5.5MM
- Garrett Hampson (3.030) – $1.8MM
- Tyler Kinley (3.014) – $1.0MM. Signed for $1.025MM prior to NT deadline
- Peter Lambert (2.116) – $600K
Royals (7)
- Andrew Benintendi (5.062) – $9.3MM
- Adalberto Mondesi (4.088) – $3.2MM
- Brad Keller (4.000) – $5.2MM
- Cam Gallagher (3.106) – $900K
- Scott Barlow (3.030) – $2.4MM
- Ryan O’Hearn (3.002) – $1.4MM
- Nicky Lopez (2.139) – $2.0MM
Tigers (8)
- Michael Fulmer (5.157) – $5.1MM
- Joe Jimenez (4.061) – $1.8MM
- Jeimer Candelario (4.038) – $5.9MM
- Jose Cisnero (4.020) – $1.9MM
- Victor Reyes (3.075) – $1.3MM
- Spencer Turnbull (3.020) – $1.8MM
- Dustin Garneau (3.015) – $1.6MM
- Harold Castro (2.141) – $1.5MM
Twins (6)
- Taylor Rogers (5.145) – $6.7MM
- Tyler Duffey (5.074) – $3.7MM. Signed for $3.8MM prior to NT deadline
- Mitch Garver (4.045) – $3.1MM
- Caleb Thielbar (3.131) – $1.2MM. Signed for $1.3MM prior to NT deadline
- Jharel Cotton (3.052) – $1.2MM. Signed for $700K prior to NT deadline
- Luis Arraez (2.121) – $2.0MM
White Sox (3)
- Lucas Giolito (4.080) – $7.9MM
- Adam Engel (4.058) – $2.2MM
- Reynaldo Lopez (4.004) – $2.8MM
Yankees (16)
- Jameson Taillon (5.110) – $4.7MM
- Joey Gallo (5.103) – $10.2MM
- Gary Sanchez (5.086) – $7.9MM
- Aaron Judge (5.051) – $17.1MM
- Chad Green (5.050) – $4.1MM
- Wandy Peralta (4.168) – $1.7MM
- Jordan Montgomery (4.153) – $4.8MM
- Gio Urshela (4.127) – $6.2MM. Signed for $6.55MM prior to NT deadline
- Luke Voit (3.169) – $5.4MM
- Gleyber Torres (3.162) – $5.9MM
- Miguel Andujar (3.117) – $1.7MM
- Clay Holmes (3.031) – $1.0MM
- Jonathan Loaisiga (3.022) – $1.7MM
- Domingo German (3.017) – $2.1MM. Signed for $1.75MM prior to NT deadline
- Lucas Luetge (3.015) – $1.1MM. Signed for $905K prior to NT deadline
- Kyle Higashioka (3.005) – $1.2MM
The arbitration projections were originally published 10-11-21. Additional information was added 2-17-22.
Projected Arbitration Salaries For 2021
Matt Swartz has created a model to project salaries for arbitration eligible players, which we’ve been publishing at MLB Trade Rumors for ten years. This winter, due to the pandemic and 60-game MLB season, there’s more uncertainty than ever with arbitration, as I explained here.
In the baseball industry, teams and agents determine arbitration salaries by identifying comparable players – a method I hope to illustrate with examples later this winter. To project the entire arbitration class in this way would take a massive amount of time and effort. So, Matt has developed an algorithm to project arbitration salaries that looks at the player’s playing time, position, role, and performance statistics while accounting for inflation. The performance of comparable players matters, but our system is not directly selecting comps for each individual player.
As a disclaimer, I should note that even in a normal year, our projections are not to be used as a scorecard for the agent and team on an individual player level. A player doing better or worse than our projection isn’t indicative of anything. Our arbitration projections are created as a tool for our readers to get a general idea of a team’s payroll situation.
This winter, those involved in the process do not know how arbitration will account for the 60-game season, nor is there an agreement in place between MLB and the MLBPA on how to address it. Many cases may end up getting resolved in a hearing room. To reflect that uncertainty, we’re providing three projections for each player:
- Method 1: Applies model directly with actual statistics from this 60-game season
- Method 2: Extrapolates all counting stats to would-be 162-game totals. One home run becomes 2.7 home runs.
- Method 3: For non-first-time eligibles, finds the raise they’d get in a 162 game season, then gives them 37% of that raise
Keep in mind that with a potential record number of non-tenders, many of these players will be released by December 2nd.
If you find MLBTR’s arbitration projections useful, please consider supporting us with a subscription.
Angels (11)
- Justin Anderson – $700K / $700K / $700K
- Matt Andriese – $1.8MM / $2.8MM / $1.9MM
- Dylan Bundy – $5.9MM / $9.8MM / $6.8MM
- Andrew Heaney – $5.0MM / $8.0MM / $5.7MM
- Mike Mayers – $800K / $1.5MM / $800K
- Keynan Middleton – $1.0MM / $1.1MM / $900K
- Shohei Ohtani – $2.1MM / $3.0MM / $2.1MM (using hitter model)
- Felix Pena – $800K / $1.3MM / $800K
- Noe Ramirez – $1.1MM / $1.2MM / $1.0MM
- Hansel Robles – $3.85MM / $4.1MM / $3.9MM
- Max Stassi – $1.8MM / $2.5MM / $1.4MM
Astros (3)
- Carlos Correa – $8.0MM / $10.2MM / $8.8MM
- Aledmys Diaz – $2.8MM / $3.1MM / $2.8MM
- Lance McCullers Jr. – $4.7MM / $7.0MM / $5.2MM
Athletics (10)
- Chris Bassitt – $3.1MM / $5.6MM / $5.5MM
- Mark Canha – $5.4MM / $8.2MM / $6.1MM
- Matt Chapman – $2.9MM / $4.3MM / $2.9MM
- Tony Kemp – $900K / $1.2MM / $900K
- Sean Manaea – $4.2MM / $6.4MM / $4.7MM
- Frankie Montas – $1.6MM / $2.4MM / $1.6MM
- Matt Olson – $3.5MM / $6.4MM / $3.5MM
- Chad Pinder – $2.2MM / $2.4MM / $2.2MM
- Burch Smith – $600K / $800K / $600K
- Lou Trivino – $900K / $1.1MM / $900K
Blue Jays (3)
- A.J. Cole – $800K / $1.1MM / $800K
- Teoscar Hernandez – $2.7MM / $5.3MM / $2.7MM
- Travis Shaw – $4.2MM / $5.4MM / $4.5MM
- Ross Stripling – $2.5MM / $3.7MM / $2.7MM
Braves (8)
- Johan Camargo – $1.9MM / $2.3MM / $1.9MM
- Grant Dayton – $900K / $1.0MM / $800K
- Adam Duvall – $4.4MM / $7.1MM / $4.7MM
- Max Fried – $2.4MM / $4.6MM / $2.4MM
- Luke Jackson – $1.9MM / $2.1MM / $1.9MM
- A.J. Minter – $1.1MM / $1.6MM / $1.1MM
- Mike Soroka – $1.8MM / $1.9MM / $1.8MM
- Dansby Swanson – $4.3MM / $8.3MM / $5.0MM
Brewers (10)
- Dan Vogelbach – $1.4MM / $1.9MM / $1.4MM
- Orlando Arcia – $2.7MM / $3.8MM / $2.8MM
- Alex Claudio – $2.0MM / $2.3MM / $2.0MM
- Ben Gamel – $1.7MM / $2.1MM / $1.7MM
- Josh Hader – $4.5MM / $6.8MM / $5.1MM
- Corey Knebel – $5.125MM / $5.125MM / $5.125MM
- Omar Narvaez – $2.725MM / $3.1MM / $2.9MM
- Manny Pina – $2.1MM / $2.3MM / $2.0MM
- Brandon Woodruff – $2.3MM / $4.5MM / $2.3MM
- Jace Peterson – $800K / $900K / $700K
Cardinals (6)
- Harrison Bader – $1.2MM / $1.7MM / $1.2MM
- John Brebbia – $800K / $800K / $800K
- Jack Flaherty – $2.2MM / $3.0MM / $2.2MM
- John Gant – $1.5MM / $1.9MM / $1.5MM
- Jordan Hicks – $900K / $900K / $900K
- Alex Reyes – $1.0MM / $1.2MM / $1.0MM
Cubs (12)
- Albert Almora Jr. – $1.575MM / $1.575MM / $1.575MM
- Javier Baez – $10.0MM / $11.9MM / $10.7MM
- Kris Bryant – $18.6MM / $18.6MM / $18.6MM
- Victor Caratini – $1.2MM / $1.6MM / $1.2MM
- Willson Contreras – $5.0MM / $7.4MM / $5.6MM
- Ian Happ – $2.5MM / $4.6MM / $2.5MM
- Colin Rea – $1.0MM / $1.6MM / $1.0MM
- Kyle Ryan – $1.2MM / $1.5MM / $1.2MM
- Kyle Schwarber – $7.01MM / $9.3MM / $7.9MM
- Ryan Tepera – $1.2MM / $1.5MM / $1.1MM
- Dan Winkler – $1.0MM / $1.2MM / $900K
- Jose Martinez – $2.1MM / $2.3MM / $2.1MM
Diamondbacks (5)
- Caleb Smith – $1.3MM / $1.6MM / $1.3MM
- Junior Guerra – $2.7MM / $3.3MM / $2.8MM
- Carson Kelly – $1.3MM / $1.8MM / $1.3MM
- Luke Weaver – $1.5MM / $2.3MM / $1.5MM
Dodgers (7)
- Scott Alexander – $1.0MM / $1.2MM / $1.0MM
- Austin Barnes – $1.4MM / $1.7MM / $1.3MM
- Cody Bellinger – $11.5MM / $15.9MM / $13.1MM
- Walker Buehler – $2.3MM / $3.1MM / $2.3MM
- Dylan Floro – $900K / $1.2MM / $900K
- Corey Seager – $9.3MM / $15.0MM / $10.4MM
- Julio Urias – $1.6MM / $3.0MM / $1.7MM
Giants (9)
- Daniel Robertson – $1.2MM / $1.3MM / $1.1MM
- Tyler Anderson – $2.4MM / $4.3MM / $3.7MM
- Alex Dickerson – $2.0MM / $3.3MM / $1.8MM
- Jarlin Garcia – $900K / $1.3MM / $900K
- Trevor Gott – $700K / $1.0MM / $700K
- Reyes Moronta – $800K / $800K / $800K
- Wandy Peralta – $1.0MM / $1.2MM / $1.0MM
- Darin Ruf – $1.4MM / $1.9MM / $1.4MM
- Austin Slater – $1.1MM / $1.7MM / $1.1MM
- Donovan Solano – $2.2MM / $3.8MM / $2.3MM
Indians (7)
- Austin Hedges – $3.0MM / $3.1MM / $3.0MM
- Adam Cimber – $800K / $1.0MM / $800K
- Delino DeShields – $2.0MM / $2.4MM / $2.1MM
- Francisco Lindor – $17.5MM / $21.5MM / $19.0MM
- Phil Maton – $700K / $1.0MM / $700K
- Tyler Naquin – $1.8MM / $2.4MM / $1.8MM
- Nick Wittgren – $1.4MM / $2.2MM / $1.5MM
Mariners (3)
- J.P. Crawford – $1.3MM / $2.4MM / $1.3MM
- Mitch Haniger – $3.0MM / $3.0MM / $3.0MM
- Tom Murphy – $1.6MM / $1.6MM / $1.6MM
Marlins (9)
- Jesus Aguilar – $3.6MM / $6.1MM / $3.9MM
- Jorge Alfaro – $1.7MM / $2.2MM / $1.7MM
- Brian Anderson – $2.2MM / $4.3MM / $2.2MM
- Garrett Cooper – $1.5MM / $2.2MM / $1.5MM
- Yimi Garcia – $1.4MM / $1.8MM / $1.4MM
- Ryne Stanek – $800K / $800K / $800K
- Jose Urena – $3.8MM / $4.2MM / $3.9MM
- Richard Bleier – $1.1MM / $1.5MM / $1.1MM
Mets (13)
- Guillermo Heredia – $1.4MM / $1.5MM /$1.3MM
- Michael Conforto – $9.0MM /$13.6MM / $10.1MM
- J.D. Davis – $1.7MM / $2.9MM / $1.7MM
- Edwin Diaz – $5.1MM / $6.5MM / $5.6MM
- Robert Gsellman – $1.2MM / $1.4MM / $1.3MM
- Seth Lugo – $2.2MM / $3.1MM / $2.4MM
- Steven Matz – $5.0MM / $5.3MM / $5.1MM
- Brandon Nimmo – $3.0MM / $5.2MM / $3.3MM
- Amed Rosario – $1.8MM / $2.6MM / $1.8MM
- Dominic Smith – $1.9MM / $3.6MM / $1.9MM
- Noah Syndergaard – $9.7MM / $9.7MM / $9.7MM
- Miguel Castro – $1.3MM / $1.8MM / $1.3MM
- Chasen Shreve – $900K / $1.1MM / $800K
Nationals (3)
- Joe Ross – $1.5MM / $1.5MM / $1.5MM
- Juan Soto – $4.5MM / $8.5MM / $4.5MM
- Trea Turner – $9.4MM / $16.6MM / $10.8MM
Orioles (6)
- Hanser Alberto – $2.3MM / $4.1MM / $2.6MM
- Shawn Armstrong – $800K / $1.0MM / $800K
- Trey Mancini – $4.8MM / $4.8MM / $4.8MM
- Renato Nunez – $2.1MM / $3.9MM / $2.1MM
- Anthony Santander – $1.7MM / $3.0MM / $1.7MM
- Pedro Severino – $1.4MM / $2.3MM / $1.4MM
- Pat Valaika – $1.1MM / $1.9MM / $1.1MM
Padres (8)
- Dan Altavilla – $700K / $900K / $700K
- Zach Davies – $6.3MM / $10.6MM /$7.2MM
- Greg Garcia – $1.6MM / $1.7MM / $1.6MM
- Dinelson Lamet – $2.3MM / $4.6MM / $2.5MM
- Emilio Pagan – $1.2MM / $1.9MM / $1.2MM
- Luis Perdomo – $1.1MM / $1.2MM / $1.0MM
- Tommy Pham – $7.9MM / $8.1MM / $8.0MM
- Matt Strahm – $1.6MM / $1.9MM / $1.6MM
Phillies (6)
- Seranthony Dominguez – $900K / $900K / $900K
- Zach Eflin – $3.3MM / $5.5MM / $3.7MM
- Rhys Hoskins – $3.4MM / $5.5MM / $3.4MM
- Andrew Knapp – $1.2MM / $1.5MM / $1.0MM
- Hector Neris – $4.8MM / $6.4MM / $5.3MM
- Vince Velasquez – $3.8MM / $4.8MM / $4.0MM
Pirates (15)
- Josh Bell – $5.1MM / $7.2MM / $5.7MM
- Steven Brault – $1.5MM / $2.5MM / $1.5MM
- Kyle Crick – $800K / $900K / $800K
- Michael Feliz – $1.1MM / $1.1MM / $1.1MM
- Adam Frazier – $3.3MM / $5.2MM / $3.7MM
- Erik Gonzalez – $1.2MM / $1.9MM / $1.2MM
- Chad Kuhl – $1.3MM / $2.2MM / $1.4MM
- Colin Moran – $1.9MM / $3.3MM / $1.9MM
- Joe Musgrove – $3.2MM / $4.4MM / $3.4MM
- Jose Osuna – $1.1MM / $1.3MM / $1.1MM
- Richard Rodriguez – $1.1MM / $1.7MM / $1.1MM
- Jacob Stallings – $1.0MM / $1.4MM / $1.0MM
- Chris Stratton – $800K / $1.2MM / $800K
- Jameson Taillon – $2.3MM / $2.3MM / $2.3MM
- Trevor Williams – $3.2MM / $4.6MM / $3.5MM
Rangers (4)
- Joey Gallo – $4.7MM / $6.8MM / $5.3MM
- Isiah Kiner-Falefa – $1.2MM / $2.3MM / $1.2MM
- Rafael Montero – $1.4MM / $2.5MM / $1.4MM
- Danny Santana – $3.6MM / $3.6MM / $3.6MM
Rays (8)
- Jose Alvarado – $1.0MM / $1.1MM / $1.0MM
- Yonny Chirinos – $1.6MM / $1.8 / $1.6MM
- Ji-Man Choi – $1.6MM / $2.1MM / $1.6MM
- Tyler Glasnow – $2.8MM / $5.1MM / $3.2MM
- Manuel Margot – $2.8MM / $3.6MM / $2.9MM
- Hunter Renfroe – $3.6MM / $4.3MM / $3.7MM
- Joey Wendle – $1.6MM / $2.7 / $1.6
- Ryan Yarbrough – $2.2MM / $3.6MM / $2.2MM
Red Sox (7)
- Matt Barnes – $3.7MM / $5.7MM / $4.1MM
- Ryan Brasier – $1.0MM / $1.6MM / $1.0MM
- Austin Brice – $700K / $900K / $700K
- Rafael Devers – $3.4MM / $6.3MM / $3.4MM
- Kevin Plawecki – $1.6MM / $2.0MM / $1.3MM
- Eduardo Rodriguez – $8.3MM / $8.3MM / $8.3MM
- Ryan Weber – $900K / $1.5MM / $900K
Reds (9)
- Brian Goodwin – $2.7MM / $3.6MM / $2.7MM
- Curt Casali – $2.0MM / $2.4MM / $1.8MM
- Luis Castillo – $3.0MM / $5.8MM / $3.0MM
- Amir Garrett – $900K / $1.4MM / $900K
- Michael Lorenzen – $3.8MM / $4.4MM / $4.0MM
- Tyler Mahle – $1.5MM / $2.5MM / $1.5MM
- Robert Stephenson – $600K / $600K / $600K
- Jesse Winker – $2.0MM / $3.4MM / $2.0MM
- Archie Bradley – $4.3MM / $5.7MM / $4.7MM
Rockies (13)
- Daniel Bard – $1.2MM / $2.2MM / $1.7MM
- David Dahl – $2.5MM / $2.7MM / $2.6MM
- Elias Diaz – $700K / $1MM / $850K
- Jairo Diaz – $800K / $1.2MM / $800K
- Carlos Estevez – $1.5MM / $2.3MM / $1.5MM
- Kyle Freeland – $3.5MM / $5.5MM / $3.9MM
- Chi Chi Gonzalez – $1.2MM / $1.2MM / $1.2MM
- Jon Gray – $5.6MM / $6.5MM / $5.9MM
- Ryan McMahon – $1.7MM / $2.8MM / $1.7MM
- Antonio Senzatela – $2.2MM / $4.9MM / $2.2MM
- Raimel Tapia – $1.5MM / $2.6MM / $1.5MM
- Tony Wolters – $1.9MM / $2.2MM / $2.0MM
- Mychal Givens – $3.4MM / $4.3MM / $3.6MM
Royals (9)
- Franchy Cordero – $900K / $1.0MM / $900K
- Hunter Dozier – $1.9MM / $2.9MM / $1.9MM
- Maikel Franco – $4.5MM / $8.0MM / $5.0MM
- Jesse Hahn – $1.1MM / $1.7MM / $1.0MM
- Jakob Junis – $1.5MM / $1.7MM / $1.5MM
- Brad Keller – $2.4MM / $4.3MM / $2.4MM
- Adalberto Mondesi – $2.1MM / $3.8MM / $2.1MM
- Jorge Soler – $7.4MM / $9.2MM / $8.0MM
- Glenn Sparkman – $600K / $600K / $600K
Tigers (9)
- Matthew Boyd – $5.5MM / $7.8MM / $6.2MM
- Jeimer Candelario – $1.7MM / $3.3MM / $1.7MM
- Jose Cisnero – $900K / $1.3MM / $900K
- Buck Farmer – $1.4MM / $1.9MM / $1.4MM
- Michael Fulmer – $2.8MM / $3.2MM / $2.9MM
- Niko Goodrum – $1.6MM / $2.5MM / $1.6MM
- Joe Jimenez – $1.0MM / $1.7MM / $1.0MM
- Jacoby Jones – $2.2MM / $2.8MM / $2.0MM
- Daniel Norris – $3.0MM / $3.4MM / $3.1MM
Twins (7)
- Jose Berrios – $4.8MM / $7.5MM / $5.3MM
- Byron Buxton – $4.4MM / $5.9MM / $4.1MM
- Tyler Duffey – $1.5MM / $2.6MM / $1.7MM
- Mitch Garver – $1.8MM / $1.9MM / $1.8MM
- Taylor Rogers – $4.8MM / $6.9MM / $5.3MM
- Eddie Rosario – $8.6MM / $12.9MM / $9.6MM
- Matt Wisler – $1.1MM / $1.8MM / $1.1MM
White Sox (7)
- Adam Engel – $1.0MM / $1.4MM / $1.0MM
- Jace Fry – $800K / $1.0MM / $800K
- Lucas Giolito – $2.5MM / $5.3MM / $2.5MM
- Reynaldo Lopez – $1.7MM / $2.2MM / $1.7MM
- Evan Marshall – $1.3MM / $1.9MM / $1.4MM
- Nomar Mazara – $5.6MM / $5.9MM / $5.7MM
- Carlos Rodon – $4.5MM / $4.5MM / $4.5MM
Yankees (11)
- Luis Cessa – $1.1MM / $1.3MM / $1.1MM
- Clint Frazier – $1.6MM / $2.6MM / $1.6MM
- Chad Green – $1.5MM / $2.2MM / $1.6MM
- Ben Heller – $700K / $800K / $700K
- Jonathan Holder – $900K / $1.0MM / $900K
- Aaron Judge – $9.2MM / $10.7MM / $9.3MM
- Jordan Montgomery – $1.2MM / $2.0MM / $1.3MM
- Gary Sanchez – $5.1MM / $6.4MM / $5.5MM
- Gleyber Torres – $2.5MM / $3.4MM / $2.5MM
- Giovanny Urshela – $3.5MM / $5.2MM / $3.5MM
- Luke Voit – $3.7MM / $7.9MM / $3.7MM
2020 MLB Arbitration Tracker Now Available
MLBTR will be keeping track of all arbitration-related figures, including settlement amounts, team and player submissions, and hearing results in our handy 2020 MLB Arbitration Tracker. The tracker is currently up-to-date for all 191 arbitration eligible players, including numbers for those who have settled on their 2020 salary. You can filter by team, service time, and signing, hearing, and Super Two status. Bookmark the 2020 MLB Arbitration Tracker today!
January 10th marks the deadline for players and teams to exchange salary figures. As ESPN’s Jeff Passan noted last January, all 30 teams now employ the “file-and-trial” approach to arbitration, meaning that if they don’t reach an agreement by the January 10th filing date, they’ll automatically go to a hearing no matter the difference. In the potentially contentious arbitration hearings, of which there were 10 last winter, a “panel of three independent arbitrators renders a winner-take-all decision,” as Passan put it. The player is in the room for the arguments, and the teams’ hardline stance means the battle can be over as little as $100K. Hearings run throughout the first three weeks of February.
Also of note: MLB Trade Rumors’ world-class arbitration salary projections, which Matt Swartz has been doing for us for the past nine years. You can check out the 2020 projections here.